Table Of Contents

Previous topic

Overview

Next topic

Getting started with the EXPERImonitor

Introduction to EXPERImonitor

A high-level architectural overview of the EXPERImonitor architecture is presented in the figure below.

../_images/image6.png

From an architectural point of view, it is useful to think of the EXPERIMonitor is a collection of experiment related services and APIs. The ‘Config’, ‘Data’, ‘Explorer’ and ‘Experiment’ services are implemented as RESTful interfaces that provide the facilities required for the web dashboard to run. The application logic that underpins these services are divided into three main components related to deployment and configuration; experiment data management; and (live) experiment monitoring. A summary of these components (and the web dashboard view) is provided in sub-sections below.

Web Dashboard View

This component provides a view on both live and previously run experiments carried out using the EXPERImonitor service. It is designed to be experimenter facing, offering control over the creation and execution of experiments as well as allow the experimenter to view metrics live (during experimentation) or explore/export data sets for later analysis.

Experiment Deployment and Configuration

The ‘Experiment Deployment and Configuration’ component (EDC) provides deployment and configuration functionality for the EXPERImonitor. Configuration details that integrate EXPERImonitor internal components as well as external (metric producing) clients to the EXPERIMonitor service are accessed and updated via this component. These include user name and password configurations for RabbitMQ and PostgreSQL resources and EXPERIMonitor entry point IDs. In addition to this, using EDC resources, developers are able to automatically and rapidly set up an EXPERIMonitor service on a virtual machine using Vagrant/Oracle VM platforms.

Experiment Monitoring (and AMQP Bus)

The ‘Experiment Monitoring’ (EM) component manages the delivery of experiment data (QoS/QoE metrics) to the EDM from experimentally instrumented technology, connected via an AMQP bus (RabbitMQ is used as the implementation). Experimenters have access to a user interface (a web based dashboard) that controls the experimental monitoring process.

Experiment Data Manager

The EDM manages the storage and retrieval of experiment related data that includes metric and provenance based data. Metric related data is stored in a PostgreSQL 9.1.x (relational) database, according to a schema reflecting the experiment metrics model. Provenance orientated data is persisted by the EDM via connection to a triple store data service. Experiment data is delivered to the EDM for storage by the EM and can be monitored by experimenters via a user interface.

The EXPERIMEDIA experiment process

The EXPERImonitor offers an experimental process through which remotely connecting EXPERImonitor compliant systems (or users, representing by such systems) are engaged. A linear set of six phases are managed by the experimenter via the EXPERImonitor, depicted in the figure below.

../_images/image7.png

All clients connecting to the EXPERImonitor must engage in the first two phases: Client connection and Discovery. In the latter stage, the client will declare to the EXPERImonitor which of the subsequent phases it supports; the EXPERImonitor adapts the remaining part of the protocol relating to these phases accordingly. Each of the experiment phases in this process is described in further detail below. A specification of the protocol used to execute each of these phases is provided in section.

Client connection to the EXPERImonitor

Before an experiment is said to begin, clients must connect to the EXPERImonitor. Connections are listened for by the EXPERImonitor dashboard indefinitely until the dashboard user (the experimenter) indicates they have all the clients they need to proceed to the first phase (proper) of the experiment.

Discovery phase

The discovery phase begins with the EXPERImonitor requesting all connected clients create a discovery interface – a communication point through which the exchange of meta-data regarding the metrics that will be provided is passed. After clients have created this interface, they send an acknowledgement to the EXPERImonitor that they are ready to begin. Subsequently, clients are queried by the EXPERImonitor about a) which of the remaining phases they support and which ‘metric generators’ they are able to provide. A metric generator is a high-level representation of a part of the instrumentation system the client will use to create measurements during the course of an experiment. This abstraction, along with others relating to the metric model, is discussed in more detail in introductory form below and in more technical detail in section Writing an EXPERIMonitor Client.

Set-up phase

Once all clients have reported their capabilities and metric descriptions, the experimenter moves the experiment phase on and so enters clients (that support it) into the set-up phase. Here, the EXPERImonitor requires the client to progressively set up the metric generators they have available for use. Clients supporting this phase respond with the result of each set-up attempt.

Live Monitoring phase

Having completed the two ‘preliminary’ phases of the experiment process, the experimenter can then choose to move into a data collection mode called the ‘Live Monitoring’ phase in which all clients that have opted to engage at this stage are signalled that they should start producing metrics. Clients will have specified whether they support the pushing or pulling (or both) of metric data by the EXPERImonitor. In the former case, clients are able to push any metric of their choosing on an ad-hoc basis (they should always wait for an acknowledgement from the EXPERImonitor after each push, however). Alternatively, clients may be pulled for a specific measurement (identified in their specific metric model) by the EXPERImonitor; a pull request is sent to the client on a periodic basis – it is the client’s responsibility to return the appropriate measure. This phase continues indefinitely until the experimenter concludes that sufficient measurements have been taken.

Post Reporting phase

After the live monitoring phase, the EXPERImonitor will contact the appropriate clients to begin the Post Reporting phase. The purpose of this phase is to allow the EXPERImonitor to retrieve metric data that was not possible to collect during the Live Monitoring phase. For example, some clients may generate data too quickly or have a network connection that is too slow for all of their data to be transferred to the EXPERImonitor in time. During this phase, clients will requested to first provide a summary of all the data they have collected during the Live Monitoring phase, and then be asked to send metric ‘data batches’ that will allow the EXPERImonitor to complete its centrally stored data set for that client.

Tear-down phase

Finally, some clients may be able to report on their tear-down process for some or all of their metric generators. In some cases, it will be useful for the experimenter to know whether the tear-down process has succeeded or not. For example, the experimenter will need to know whether or not users (represented by the connected client) have been successfully de-briefed on the completion of an experiment.

Primary metric dimensions

An important aspect of the EXPERImonitor’s support for experimental processes is the specification and delivery of various kinds of metrics that will form a significant component of the final analysis of a FMI system. The experiment data and monitoring processes offered by the EXPERImonitor focuses specifically on the generation and capture of quality of service (QoS), quality of experience (QoE) and quality of community (QoC) metrics. The characteristics of each dimension vary and are summarized in the table below.

Table 1 : Metric dimensions

Dimension Characteristics
QoS Based on data from a manufactured sensor or computing machine, these measurements are based on objective and verifiable samples of the physical world.
QoE A synthesis of data that can either be based on quantitative measures from the physical world (such as human-computer interaction logging) or on qualitative data that has been subjectively assessed by a human (an evaluation of the level of ‘immersion’, for example).
QoC A synthesis of data, primarily based on objectively measurable features of a social network environment (such as the number of responses in an on-line dialogue). Other qualitative and subjective measures that may be inferred by humans or machines (trained by humans) may also be used (the application of sentiment analysis is one such example).

A selection of metrics from each of these dimensions may be used by an experimenter to better understand how people and technology interact and perform during the course of an experiment.

EXPERImonitor metric model overview

The EXPERImonitor offers a metric modelling framework that offers support for a range of potential QoS, QoE and QoC measurements, see the figure below.

../_images/image8.png

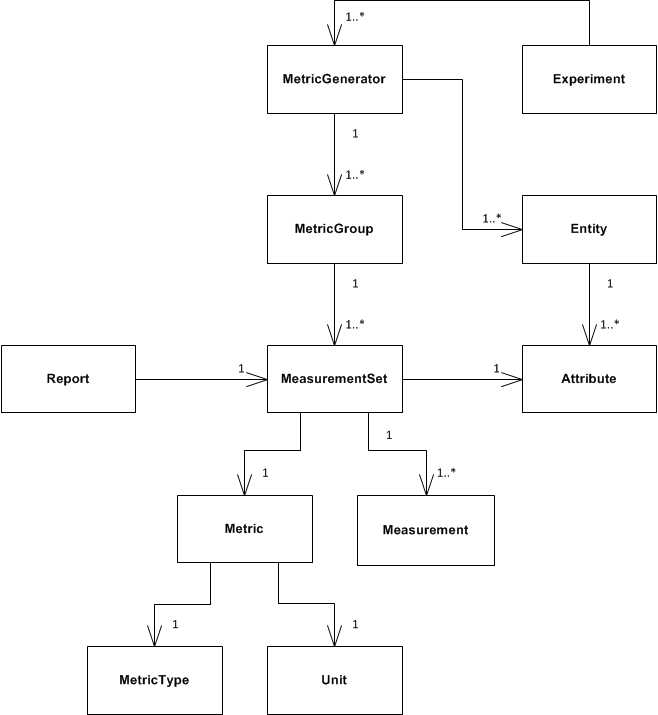
In this model, the objects of experimental observation (referred to as ‘Entities’) are de-coupled from the agent (the EXPERImonitor software client) making the observations. Entities themselves must contain one or more Attributes that are be the subject of actual instrumentation and measurement activity. A simple example of such a relationship is presented below in which an EXPERImonitor client (called ‘SocialAuth ECC client’) observes a Facebook event.

../_images/image9.png

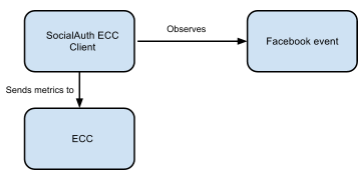
This very basic relationship need to be developed further however, since a) entities (in this case the ‘Facebook event’) will have certain attributes that are of interest to the client and the b) some organisation of the structure of the metric data associated with the entity must also be prescribed. To see how this is arranged, consider the figure below.

../_images/image10.png

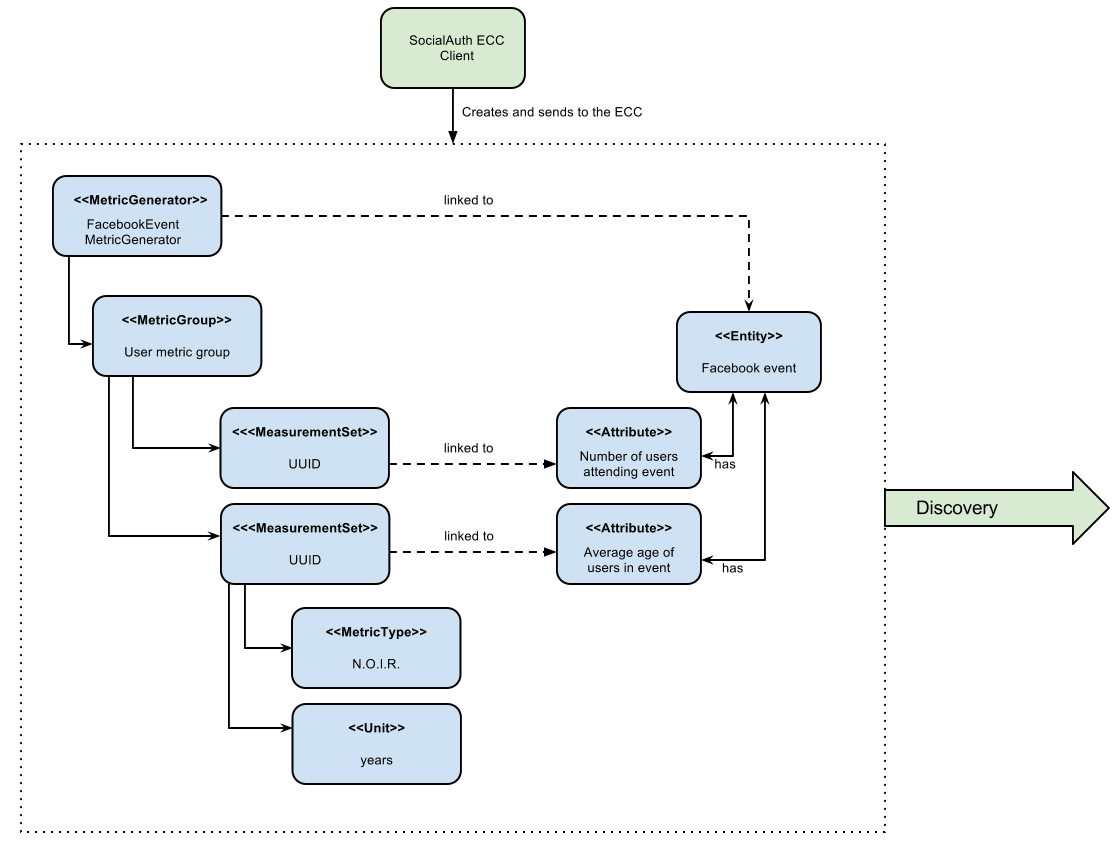
In this example, we have added two attribute instances to the entity, representing aspects of the Facebook we have an interest in observing (i) the number of users attending the event and (ii) the average age of users in the event. We can consider the data management structures that support the collection of data representing these two attributes from either a ‘top-down’ perspective (starting from Metric Generators) or from a ‘bottom-up’ view point, starting with a data collection type (the MeasurementSet type) that is mapped directly to an attribute of interest. For this example, we will take the latter approach and start by directly linking data sets to an attribute.

The Measurement Set type holds a set of measurements that specifically relate to an attribute and in addition has associated with it a metric meta-data indicating its Metric Type (nominal; ordinal; interval or ratio) and its Unit of measure. In the diagram above, we see two instances of Measurement Sets (each uniquely identified by a UUID value) which are mapped directly to the attributes of interest.

Table 2 : Example metrics

Notes Metric Group Measurement Set ID Metric Type Metric Unit Attribute Entity
QoS examples for a media server running an FMI video streaming service. Server QoS group 2a6bb6b3-2465-4dc5-980b-cb8f78043a7a RATIO Milliseconds PING network response Media server
Server QoS group ed3bf728-cd65-4bb3-8453-446f7e56c0f4 RATIO Frames/second Video transcoding rate Media server
QoS example for a client connected to an FMI video streaming service. Client QoS group 328cadc6-afea-481a-9b49-9ca3a63ae252 RATIO Frames Dropped frame count Client receiver
QoS environment data example Client QoS group d8087fbe-ae37-4325-a8ee-79cffc99071c INTERVAL Celsius Temperature Client device
QoE video streaming experience report; a pre-defined 7 point Likert scale is used as a basis. Client QoE group 7620bf4b-0a51-41b8-9a17-870f2454cd78 ORDINAL Likert 7-scale Perceived video smoothness User
QoE interaction logging (Nominal ‘Action’ definitions should be pre-defined in a dictionary). Client QoE group 8fcfdf27-a51e-455a-8621-47e5fa4d264d NOMINAL Action Video player interactions User
QoC activity for FMI community QoC community group 5fb41674-490a-4bb8-be99-e20adf2fd7e1 RATIO Log-ins/day User log-ins FMI community
QOC activity for user of FMI community (URL to publicly available content) QoC user group 0b789291-4392-4288-95af-544486508a85 NOMINAL Content post User content Client device

In the table above a number of illustrative examples of metrics from QoS, QoE and QoC domains are shown (with notes to offer context). Reading from left to right, we can see how groups of metric sets (each with an associated metric type and unit) are mapped to the entities under observation in the real or virtual world. To save space, metric generator mappings have not been included.

Moving up the data hierarchy, the next level of logical organisation is the Metric Group – a container used to perform one level of partitioning for collections of measurements that relate (for example, video rendering metrics). Metric Groups themselves are collected together by the top level data organisation, the Metric Generator. As previously indicated, the Metric Generator represents system-level components that generate metrics, for example it may be useful to differentiate server and client based metric generators. An additional mapping, similar to that used to link measurement data sets to attributes is specified linking metric generators to entities under observation since it is likely that individual systems will be deployed to observe different entity types. EXPERImonitor client software must send their specification of the metrics they are going to provide the EXPERImonitor in this way, during the Discovery phase. In this way, the experimenter has a means by which to understand which clients are performing what kind of measurements, and what they relate to within the experimental venue.