Writing an EXPERImonitor client
Introduction
In this part of the documentation, we provide you with a technical guide on how to write software using the EXPERImonitor API. This section is primarily intended for software engineers - a higher level introduction to the EXPERImonitor can be found at the beginning of this document.
Here we present:
- Key concepts for the EXPERImonitor client writer
- The basic architectural pattern for EXPERImonitor clients
- An overview of EXPERImonitor API classes
In the later section (‘Advanced EXPERImonitor client programming’) we explore some of the more advanced aspects of EXPERImonitor client writing including guidelines for EXPERImonitor integration and an introduction to generating Provenance based experimental data.
EXPERIMEDIA’s baseline technologies provide the technologist and experimenter a set of FMI technologies for integration within both the content and experiment life-cycles. From a purely experimental point of view, the experimenter will have access to a number of metrics already available for use from the baseline components themselves. For a list of these metrics, see section ‘Baseline Metric Services’.
It is anticipated that additional metrics, based on observations of the behaviours of the new technologies brought to the EXPERIMEDIA baseline (or users associated with their use), will also need to be captured. In the following sections, we will explore how an EXPERImonitor client can be developed to communicate metrics during the experimental process.
Key EXPERImonitor client concepts
When setting out to write an EXPERImonitor client there a number of high-level, key concepts that you need to be familiar with before development begins.
- Connecting to the EXPERImonitor using unique identifiers
- The EXPERImonitor metric model
- Pushing and pulling metric data
Connecting to the EXPERImonitor using unique identifiers
The EXPERImonitor API makes extensive use of unique identifiers (referred to as UUIDs or GUIDs). Before any other kind of communication can happen between the EXPERImonitor and an EXPERImonitor client, the client must first try connecting to the EXPERImonitor (via RabbitMQ). In order to do so, the client minimally requires:
- The RabbitMQ server IP, port number and authentication (username/password)
- A UUID that identifies EXPERImonitor service deployment
- A UUID that identifies the client (software process) to the EXPERImonitor service
It is typical that the information relating to [1] and [2] above will remain constant throughout the lifetime of an EXPERImonitor based experimental project. The UUID used by the client is up to the client writer: you may wish to re-use a single UUID or generate a new one each time your client connects to the EXPERImonitor. Below is a summary of the advantages and disadvantages of both approaches:
| Connect strategy | Advantages | Disadvantages |
| Connect client with same UUID |
|
|
| Connect client with new UUID |
|
|
For further discussion on this topic, see the Disconnection/re-connection strategies section in this document.
The EXPERImonitor metric model
Central to an experiment is the experimental metric model: a collection of observable entities (‘things’ that have attributes describing aspects of them in some way). The EXPERImonitor metric model separates the specification of the things we wish to observe from the measurement units and raw data used to specify an observation. This allows experimenters to attach multiple data sets to the same observable phenomenon in a variety of ways. For example, the colour of the surface of an object could be quantitatively measured (simplistically) using a light sensor as the reflected wave length of light in nanometres, say 475nm, or qualitatively by way of a reported human observation as the nominal value ‘Blue’.
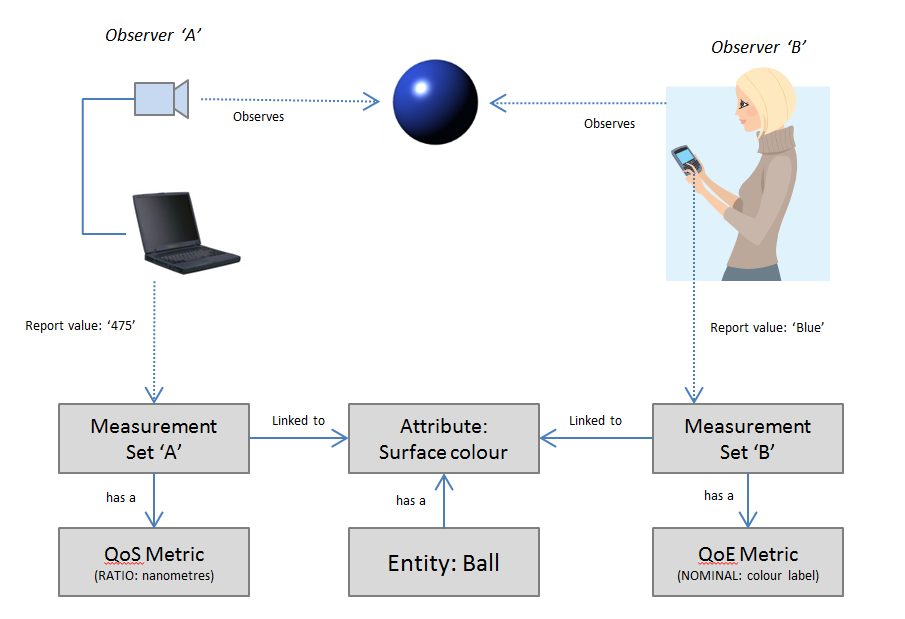
Using this approach, metric models can be potentially shared between clients, meaning a super set of observations can be made from the aggregation of multiple data sets. For example, we could imagine multiple users reporting their qualitative observations of the same entity during the course of an experiment.
An EXPERImonitor client creates a metric model to describe what it is observing during an experiment. This model is sent to the EXPERImonitor service, which allows it to recognize and store (in a consistent way) the metric data sent by multiple clients as well providing the experimenter some fine-grained control over the data-flow of experimental data at run-time (see the More advanced EXPERImonitor clients section for further information). Almost all the components of the EXPERImonitor metric model are uniquely identified using UUIDs: this means that if you wish to re-use (or share) the same metric model during an experiment, you must ensure that this model remains consistent - see the Disconnection/re-connection strategies section for a further discussion of this.
Pushing and pulling metric data
At run-time, clients can elect to either PUSH metric data to the EXPERImonitor or allow the EXPERImonitor to query them (by PULLing) for metric data periodically. As has been already stated, EXPERImonitor clients are connected to the EXPERImonitor service via an Internet connection which may be discontinuous. The EXPERImonitor API will throw exceptions in any case where a client attempts to send data to the EXPERImonitor and network connectivity is no longer available. However, be aware that the EXPERImonitor API currently does not actively monitor network connectivity on the client’s behalf: if the client is waiting for its next PULL request, it may do so indefinitely if a network connection is no longer available.
Below is a summary of the advantages and disadvantages of both PUSH and PULL strategies:
| Data sending strategy | Advantages | Disadvantages |
| Pushing client |
|
|
| Pulling client |
|
|
Some examples for selecting an appropriate integration strategy is discussed in more detail in the section ECC Integration pattern guidelines.
Basic monitoring pattern
In this section, we look at a general monitoring pattern suggested for EXPERImonitor client writers; the principal (Java) classes that are used by a client; a review of two sample clients provided in the EXPERImonitor API; how to test a client; and finally a review of the indicative sample code.
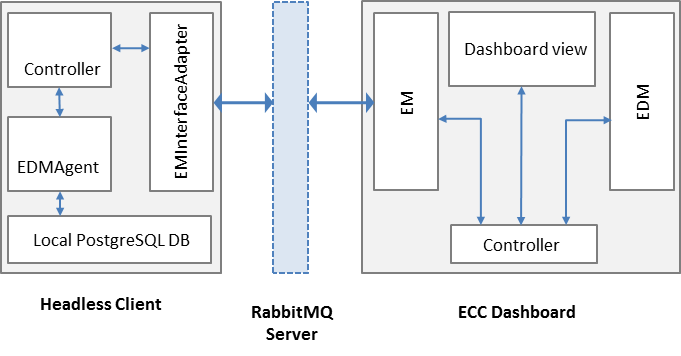
Figure 9 : Client/EXPERImonitor high-level monitoring pattern
The basic monitoring pattern recommended for client writers is illustrated in the figure above. Here, we see the ‘Headless client’ (a client with no user interface) connected to the EXPERImonitor (and its dashboard) via a RabbitMQ server. This client uses the EMInterfaceAdapter class to help handle the messages passing executed during the experimental phases. Its controller responds to the essential requests for information via the adapter and, during Live Monitoring and Post Reporting phases, uses an instance of the EDMAgent to help manage its metric data. Meanwhile, the EXPERImonitor handles in-coming and out-going messages via the Experiment Monitor (EM) sub-component; stores all metric data it receives from the client using its Experiment Data management (EDM) sub-component; and presents the experimental process to the user via the dashboard view.
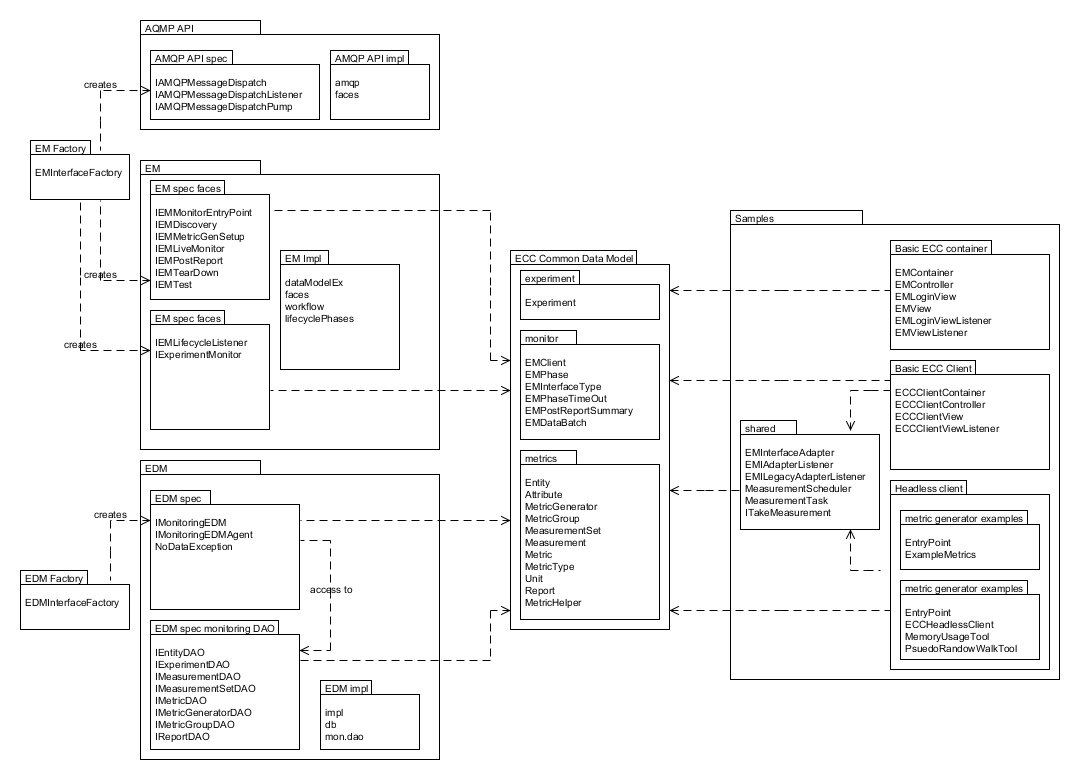
Figure 10 : Client writing classes overview
Client writers are likely to encounter many, or all, of the classes presented here – relevant EXPERImonitor API packages are presented on the left and centre; example client code on the right. Each client will use the factory classes to create EXPERImonitor interface classes that provide access to the monitoring protocol classes (within EM) and the experiment data management classes (EDM).
Common data classes shared by all scopes illustrated above provide the fundamental data types to be exchanged and populated during an experimental process. The ‘Basic ECC container’ sample is a desktop testing for early development phases that provides ‘bare bones’ EXPERImonitor server behaviour (it still requires a RabbitMQ server to be installed) and a means by which basic communication can be tested. For more information on the use of this tool, see technote ‘T05 ECC sample notes V1.0’ packaged within the API.
Software engineers should review these classes and their use through reading the JavaDoc provided in the EXPERImonitor API. The bundled example clients (‘Basic ECC Client’ and ‘Headless Client’) are described in more detail below.
EXPERImonitor example clients
It is relatively simple to start writing your own EXPERImonitor client. Interested developers should first look at one or both of the following sample client projects:
| Client | Description |
| Basic ECC Client | A simple client that generates only one metric at run-time. This client can push (via the user interface) and pull this metric data. It does not store any of its metric data locally or support the Post Reporting phase. Look at this client first before looking at Headless client. |
| Headless ECC Client | The headless client is indicative of the kind of implementation that might be suitable for running on a server. No user interface is provided. This client uses the EXPERImonitor’s IMonitoringE DMAgent interface to store its metric data on a PostgreSQL data and also the MeasurementScheduler to automate the regular collection of metric data. Live Monitoring and Post Reporting is fully supported; review this sample to see how the use of the IMonitoringEDMAgent helps you manage your metric data and communication with the EXPERImonitor. |
| Dynamic Entity Demo ECC Client | An extended version of the Basic ECC Client that allows the user to dynamically created Entities at any point after the experiment process has started. Users can enter details of new entities and their attributes via a desktop UI; new entities and attributes are created and sent to the EXPERImonitor. Dummy metric data is provided by the client for all new entities/attributes. |
| Basic Android Client | This is a simple client that demonstrates integration with the EXPERImonitor on the Android 4.2.x platform. This client provides a basic UI with which the user can select the IP of the RabbitMQ server and then later push a simple metric to the EXPERImonitor. For more information on the specific build process for this client (which requires Google’s Android SDK, please see the README). |
| Basic .Net Client | A simple C# client that works in a similar way to the Java based Headless ECC Client (this client API does not yet provide local EDM metric database support). This client runs from the command line. |
| Basic C++ Client | A simple C++ client that works in a similar way to the .Net/Java headless clients (this client API does not yet provide local EDM metric database support). This client runs from the command line. |
All sample code can be found at the top level of the EXPERImonitor API under the folder ‘samples’. As a new client writer you may wish to adopt a similar pattern to the clients found here (by using the EMInterfaceAdapter class and listening to its events as described by EMIAdapterListener); more experienced software engineers may wish to directly use the EXPERImonitor protocol interface classes hidden by the EMInterfaceAdapter themselves.
For the sake of brevity, the specifics of the more recent EXPERImonitor clients (Android; .Net; C++) are not detailed here since the application very closely follows the pattern adopted by the Java Basic ECC and Headless ECC clients.
Client samples in more detail
A high-level class view of the client code samples (both ‘basic’ and ‘headless’) can be seen in the figure below:
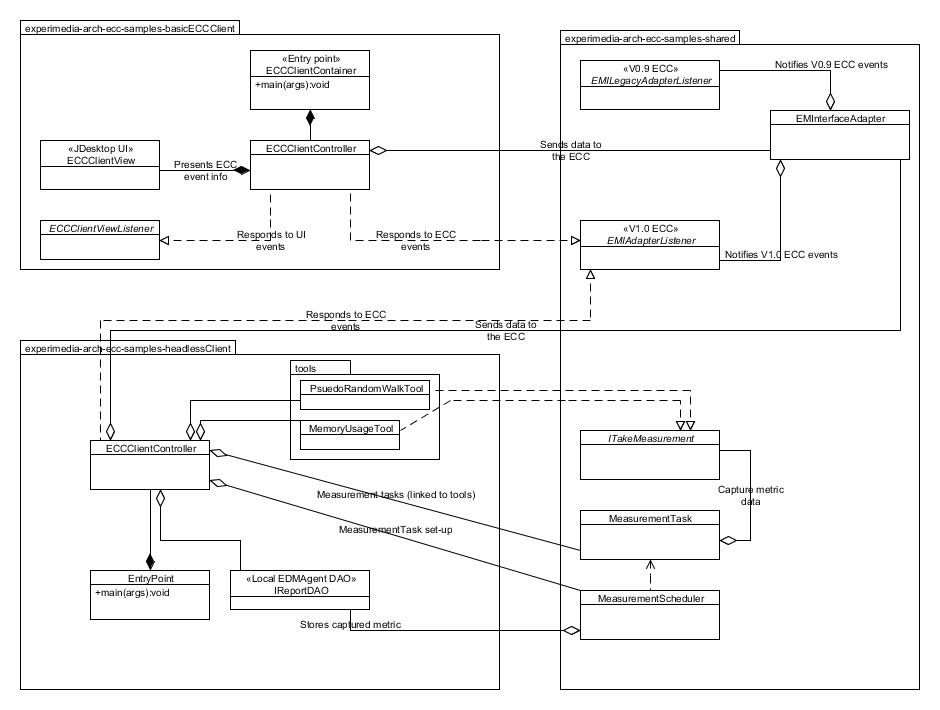
Figure 11 : Client class interactions for sample code
As indicated in the figure above, both client samples share the use of adapter classes (a legacy class adapter is also provided in the shared package, but this is now deprecated). An MVC architecture is applied in the Basic ECC Client; the headless client does not require this structuring. The ‘tools’ sub-package demonstrates how individual classes can be used to encapsulate actual measurement behaviour which can be abstracted scheduled as required.
Class roles
The roles of each class in the client sample code are as follows:
ECCClientContainer (basic)/EntryPoint (headless) classes
Both classes simple act as the entry point for the client application. In addition to this, the ‘headless’ entry point class demonstrates how property files can be used to set up connection to the EXPERImonitor and create a local EDMAgent.
ECCClientController (Basic client only)
This class co-ordinates ‘high level’ EXPERImonitor monitoring actions and event handling that is conducted via the EMInterfaceAdapter class. Actions include registering (or ‘connecting’) with the EXPERImonitor; sending metric generator information; responding to set-up and tear-down processes. In the ‘basic’ client, the controller sends message information to the UI and responds to a simple user interaction.
ECCClientView (Basic client only)
This view class implements a Java desktop window containing a ‘logging’ panel and a button with which the user can manually push metric data to the EXPERImonitor during the live monitoring phase.
ClientViewListener (Basic client only)
Listening to events generated by the EMClientView is implemented by the ECCClientController using this interface.
EMInterfaceAdapter
Simplified interaction with the EXPERImonitor is achieved through the use of this adapter and its listening interface (EMIAdapterListener). The EMInterfaceAdapter hides some of the more ‘technical’ aspects of communicating with the EXPERImonitor as a client. These aspects include: setting up interfaces that communicate with the EXPERImonitor during different phases on an experiment; listening directly to events sent by the EXPERImonitor to the client; sending data to the EXPERImonitor. More information about the use of these interfaces can be found in the EXPERImonitor API JavaDoc.
EMIAdapterListener
The EMIAdapterListener is implemented by the ECCClientController and is used to respond (at a high level) to the requests of the EXPERImonitor.
ECCHeadlessClient (Headless client only)
This class is analogous to the ECCClientController found in the basic client code, however, instead of managing a UI, it instead schedules metrics for measurement and stores the data in a local database managed by an EDMAgent (see IMonitoringEDMAgent). Please note that this class can work without invoking the EDMAgent, but it will not be able to respond properly to the EXPERImonitor’s requests for missing data during the Post-Reporting phase as no local storage has been set aside for metric data. In this case, the headless client will simply create metric data ‘on-the-fly’ and respond with this information when the EXPERImonitor requests it.
EDMAgent: IMonitoringEDMAgent & IReportDAO (Headless client only)
An EDMAgent is constructed using the EXPERImonitor’s EDMInterfaceFactory static class; the agent is then tested to see if a database is available for use and an IReportDAO instance is created. The IReportDAO instance provides the client with the facility to store metric data as it is generated (in report form) and then later retrieve it as required (an example of this can be seen in the ‘onPullMetric(…)’ event implemented by ECCHeadlessClient). The same instance of the IReportDAO is used during the setting up of a scheduled measurement activity (see the ECCHeadlessClient method ‘setupMeasurementForAttribute(…)’ for further information); this allows a background thread to continuously feed the EDMAgent with new metric data as it arrives.
Tools: PsuedoRandomWalkTool & MemoryUsageTool (Headless client only)
Two trivial metric producing classes (both implementing the ITakeMeasurement interface) have been supplied for use in the headless client. The PsuedoRandomWalkTool class simulates the change in direction a walker might take on a random path (providing their direction in degrees: 0:-359). The MemoryUsageTool takes a rough estimation of the memory being used by the headless client at run-time.
Testing clients against the EXPERImonitor
To manually test the existing client samples, follow these steps:
Open a command line at the root of the EXPERImonitor API folder
Type: mvn clean install
Create two folders (elsewhere in your file system):
- client
- container
Search for all JARs created in the root folder of the EXPERImonitor API folder
Copy all JARs (ignoring duplicates found in the dashboard) to both folders created in step 3.
- Start the Basic ECC Container in the container folder by running the following JAR::
experimedia-arch-ecc-samples-basicECCContainer-<version>.jar
Start the Basic ECC Client or Headless client in the client folder by running the following JAR:
experimedia-arch-ecc-samples-basicECCClient-<version>.jar

experimedia-arch-ecc-samples-headlessECClient-<version>.jar
Alternatively, look in the ‘bin’ folder of the EXPERImonitor root directory for pre-compiled demos.
Indicative code
Developers are directed to the following code sections for each of the experiment phases supported by the sample client code.
Connecting/Disconnecting with the EM
| High-level handling | Lower-level handling |
EMClientController.onEMConnectionResult() EntryPoint.initialiseClient() ECCHeadlessClient.tryConnectToAMQPBus() ECCHeadlessClient.tryRegisterWithECCMonitor() ECCHeadlessClient.onConnectionResult() ECCHeadlessClient.onEMDeregistration() |
EMInterfaceAdapter.registerWithEM() EMInterfaceAdapter.disconnectFromEM() EMInterfaceAdapter.getExperimentInfo() |
Discovery phase
| High-level handling | Lower-level handling |
Basic/Headless . onPopulateMetricGeneratorInfo() Basic/Headless.onDescribeSupportedPhases() Basic/Headless.onDescribePushPullBehaviours() Basic/Headless.onDiscoveryTimeout() |
EMInterfaceAdapter.onCreateInterface() EMInterfaceAdapter.onRegistrationConfirmed() EMInterfaceAdapter.onDeregisteringThisClient() EMInterfaceAdapter.onRequestActivityPhases() EMInterfaceAdapter.onDiscoverMetricGenerators() EMInterfaceAdapter.onRequestMetricGeneratorInfo() EMInterfaceAdapter.onDiscoveryTimeOut() EMInterfaceAdapter.onSetStatusMonitorEndpoint() |
Set-up phase
| High-level handling | Lower-level handling |
Basic/Headless.onSetupMetricGenerator() Basic/Headless.onSetupTimeOut() |
EMInterfaceAdapter.onCreateInterface() EMInterfaceAdapter.onSetupMetricGenerator() EMInterfaceAdapter.onSetupTimeOut() |
Live-monitoring phase
| High-level handling | Lower-level handling |
Basic/Headless.onLiveMonitoringStarted() Basic/Headless.onStartPushingMetricData() Basic/Headless.onPushReportReceived() Basic/Headless.onPullReportReceived() Basic/Headless.onStopPushingMetricData() Basic/Headless.onPullMetric() Basic/Headless.onPullMetricTimeOut() Basic/Headless.onPullingStopped() |
EMInterfaceAdapter.onCreateInterface() EMInterfaceAdapter.onStartPushing() EMInterfaceAdapter.onReceivedPush() EMInterfaceAdapter.onStopPushing() EMInterfaceAdapter.onPullMetric() EMInterfaceAdapter.onReceivedPull() EMInterfaceAdapter.onPullMetricTimeOut() EMInterfaceAdapter.onPullingStopped() |
Post-report phase
| High-level handling | Lower-level handling |
Basic/Headless.onPopulateSummaryReport() Basic/Headless.onPopulateDataBatch() Basic/Headless.onReportBatchTimeOut() |
EMInterfaceAdapter.onCreateInterface() EMInterfaceAdapter.onRequestPostReportSummary() EMInterfaceAdapter.onRequestDataBatch() EMInterfaceAdapter.notifyReportBatchTimeOut() |
Tear-down phase
| High-level handling | Lower-level handling |
Basic/Headless.onGetTearDownResult() Basic/Headless.onTearDownTimeOut() |
EMInterfaceAdapter.onCreateInterface() EMInterfaceAdapter.onTearDownMetricGenerators() EMInterfaceAdapter.onTearDownTimeOut() |
EXPERImonitor specification files
EXPERImonitor is configured in an application.properties file which is split into several sections:
| Property label | Description | Example |
|---|---|---|
| server.port | Port to run the server on when using Spring bootstrap | 8083 |
| server.context-path | The root of the server URL | /ECC |
Configuration options for the EXPERIMEDIA config service begin “ecc.projectconfig”:
| Property label | Description | Example |
|---|---|---|
| ecc.projectconfig.endpoint | Address of the config service | http://config.experimedia.eu |
| ecc.projectconfig.projectName | Default project name | default |
| ecc.projectconfig.username | Username to access the service | username |
| ecc.projectconfig.password | Password to access the service | password |
| ecc.projectconfig.whitelist | Comma-separated list of config entries to show in the dashboard | Default,EX10,EX11 |
Default settings:
| Property label | Description | Example |
|---|---|---|
| ecc.configuration.projectName | Default project name | My Local EXPERIMEDIA Project |
Default settings for RabbitMQ:
| Property label | Description | Example |
|---|---|---|
| ecc.configuration.rabbitConfig.monitorId | UUID of this EXPERImonitor dashboard instance | 00000000-0000-0000-0000-000000000000 |
| ecc.configuration.rabbitConfig.ip | IP address of RabbitMQ service | 127.0.0.1 |
| ecc.configuration.rabbitConfig.port | Port for the RabbitMQ service | 5672 |
| ecc.configuration.rabbitConfig.userName | Username to connect with | guest |
| ecc.configuration.rabbitConfig.userPassword | Password to connect with | guest |
| ecc.configuration.rabbitConfig.keystore | Location of Java keystore to use for SSL connections | |
| ecc.configuration.rabbitConfig.useSsl | Whether to use a keystore or not | false |
Default settings for the PostgreSQL database:
| Property label | Description | Example |
|---|---|---|
| ecc.configuration.databaseConfig.url | URL of PostgreSQL server | localhost:5432 |
| ecc.configuration.databaseConfig.databaseName | Name of the database | edm-metrics |
| ecc.configuration.databaseConfig.userName | Username to connect with | postgres |
| ecc.configuration.databaseConfig.userPassword | Password to connect with | password |
| ecc.configuration.databaseConfig.databaseType | Database type (currently only PostgreSQL supported) | postgresql |
Miscellaneous default settings:
| Property label | Description | Example |
|---|---|---|
| ecc.configuration.miscConfig.snapshotCount | Number of points to display on live charts | 50 |
| ecc.configuration.miscConfig.nagiousUrl | Address of Nagios monitoring system (no longer used) | http://username:password@host/nagios |