More advanced EXPERImonitor Clients
EXPERImonitor Integration pattern guidelines
As an EXPERImonitor client writer, it is important to be mindful of the technical and real-world context in which you wish to gather experimental data. During an experiment you may wish to instrument hardware and software or capture user interactions and quality of experience. Your choice of observational methodology and the context in which it is carried out is likely to influence your choice of EXPERImonitor integration.
Consider the following entities that you may wish to observe during an experiment:
- A professional software process or service
- A small-scale, public interactive system
- A mobile application
Each of these examples have different system behaviours and interactions (via the Internet) with the outside world. Two important considerations that link your system design with EXPERImonitor integration are:
- Does the system have observable characteristics that can be captured continuously?
- How reliable is the Internet connection used by the system?
In the follow sub-sections, we will explore the three observational scenarios identified above and relate these considerations in each case.
Example use-case: a professional software process or service
Imagine a software artefact that provides a video transcoding service to external software clients. Over the course of an experiment that lasts perhaps one month, you are interested to monitor QoS metrics such as CPU load; the length of the video transcoding queue; the current rate at which a video stream is being transcoded and so on. Service requests made of this could happen at any time and so we might reasonably expect it to be accessible 24 hours a day. Due to the nature of the task and the fact that it is an on-line service, we would say:
- Continuously observable properties: Yes. (QoS metrics are always measurable)
- Reliable Internet connection: Yes. (The requirements of this service are likely to require a reliable connection)
Suggested EXPERImonitor integration
In this use case you should consider creating an EXPERImonitor client that has a fixed UUID and metric model that responds to PULL requests from the EXPERImonitor since the software artefact and its behaviour is expected to exist continuously and reliably throughout the course of an experiment. In the (rarer) cases where this system looses its Internet connection, this drop in service is likely to be quickly detected by some part of the system and a connection re-established with the EXPERImonitor once it is contactable once again.
Example use-case: a small-scale, public interactive system
Perhaps you have a small-scale experiment that includes providing (temporary) access to a public information system such as an interactive information display or game station, requiring access to on-line data or services. Such as system is likely to have similar characteristics to those of the continuously running software process described above. Such systems may be instrumented using QoS based metrics such as ‘display frame rate’ or ‘network bytes sent per second’: these are measurements that could be queried on a continuous basis (the system is expected to run continuously without interruption). In addition to these, metrics that count the overall usage of certain interactive components by users might also be reported over time (such as the number of times a user has selected a particular product). However, unlike the professional use case described above, this installation may be deployed on a low-cost Internet infrastructure that is not always reliable. In this case, we would say:
- Continuously observable properties: Yes. (The system runs continuously without interruption and can provide data at any time)
- Reliable Internet connection: No. (Network connectivity may be poor or dropped occasionally)
Suggested EXPERImonitor integration
Systems that only access the Internet on an ad-hoc basis may only be aware of network loss at some indeterminate point of time in the future - this use case is an example of one such system. In this case, you may choose to integrate with the EXPERImonitor as a client with a fixed UUID and metric model that either responds to PULL requests or just sends PUSHes. If the system already regularly monitors network connectivity, then a strategy similar to the first use case is a good idea; if not, then the client writer should consider just pushing metric data (as this will throw exceptions in the case when metric data can no longer reach the EXPERImonitor).
Example use-case: a mobile application
Now imagine a mobile application running some software that provides a new kind of interactive experience using data shared with other mobile users across the Internet. This software is placed in the hands of users who exercise discretionary control over its execution, use and access to a data network (which itself is quite likely to be unreliable). Perhaps this application captures a range of subjective quality of experience measurements that are gathered on an ad-hoc basis from the user. In this case we would say:
- Continuously observable properties: No. (Ad-hoc application use and unpredictable user interactions cannot be continuously sampled)
- Reliable Internet connection: No. (Network performance can be expected to be highly unreliable)
Suggested EXPERImonitor integration
It is clear in this case that a continuous data stream to the EXPERImonitor cannot be relied upon. The most robust approach to maintaining a consistent ‘view’ on each mobile application’s data is for the software to persist its client UUID and metric model and then re-send it and any available metric data when it is able to do so over a good Internet connection.
Disconnection/re-connection strategies
Your EXPERImonitor client software is typically remotely connected to the EXPERImonitor via an Internet connection. As with writing any software that communicates with other software via an Internet connection, there may be occasions when communication between your client and the EXPERImonitor becomes severed at run-time. There may be a number of reasons for this disconnection: some are the result of deliberate actions by the software, others may be the result of a network or system failure. The EXPERImonitor API does not automatically attempt to restore a connection to the EXPERImonitor on your behalf - this is currently the responsibility of the client software. In this section, a number of strategies for dealing with situations like these are presented below; technical notes for guidance follow.
SCENARIO 1
The EXPERImonitor client is disconnected from the network: the client wishes to reconnect as the same client to current experiment running on the EXPERImonitor.
This scenario is the most common for client writers and is a typical case for mobile devices operating on a public network, such as an Android application running on a mobile phone. In this case, there are two possible options:
Store and re-use your existing metric model when you re-connect to an experiment. When your client re-connects with the EXPERImonitor, it will be asked to send its metric model - it can simply re-send the model it used before (this is simple if the model is still held in memory). Currently there is no direct support for reading/writing the metric model from/to disk, however this can be achieved relatively simply using one of the following methods:
1.1 Java: the metric model is serializable or can be ‘JSONized’ (using the GSON library, for example)
1.2 C# : the metric model can be ‘JSONized’ (using the Newtonsoft JSON library, for example)
1.3 C++ : the metric model can be ‘JSONized’ (using the ‘toJSON(..)’ and ‘fromJSON(..)’ methods on the model classes [requires BOOST JSON support]
Create and send a new metric model (however, this will add duplicated entities to the experiment). If your client is ‘pulled’ by the EXPERImonitor, it will continue to receive requests for data for measurement sets relating to the old model: simply return empty reports in this case. Clients pushing data to the EXPERImonitor do not need to take any further action.
It is currently the client’s responsibility to re-connect to the EXPERImonitor after a network disconnection. See section ‘Reconnecting your client (technical)’ to understand how to present your client as the same instance to the EXPERImonitor.
SCENARIO 2
Client crashes and is unable to locally recover any experiment related data. The client is re-started and attempts to connect to an existing experiment running on the EXPERImonitor.
Here, we assume that no experiment related data (such as a metric or provenance model) was stored or can be recovered by the client. In this situation, your software should connect to the EXPERImonitor as a new client, creating and sending a new metric model to the EXPERImonitor. This new model will be added to the current experiment and result in duplicated entities that your client has reported represented in the experiment.
SCENARIO 3
The RabbitMQ server crashes.
If the RabbitMQ service crashes or is shutdown (this is a rare event), communications between the EXPERImonitor and its clients will fail. In this case, EXPERImonitor clients should close down their connection to the EXPERImonitor and the experimenter should stop the current experiment.
Once the RabbitMQ service has been restarted, the experimenter will then re-establish the EXPERImonitor’s connection to the Rabbit server by returning to the dashboard configuration page and attempting a reconnect. If successful, the experimenter should then start a new experiment. Clients should reconnect to the EXPERImonitor and send a new metric model for the new experiment.
SCENARIO 4
The EXPERImonitor service crashes.
In the case where the EXPERImonitor service crashes, any currently running experiment will be discontinued and the experimenter will have to create a new experiment once the EXPERImonitor has been restarted. Once the EXPERImonitor has been restarted and a new experiment is created, all previously connected clients (that remain connected to the RabbitMQ server) will be sent a message to start a new experiment by the EXPERImonitor. Client should create a new metric model for the new experiment.
Reconnecting your client (technical)
When connecting (or re-connecting) to the EXPERImonitor, your client identifies itself using a UUID which allows the EXPERImonitor to uniquely identify your client. This is done using the class and method call EMInterfaceAdapter.registerWithEM(..) (parameter 4). If you wish to re-connect to an experiment as the same client instance, you should use the same client UUID as you used previously.
Each new experiment requires a new metric model from your client (to ensure consistency within the EXPERImonitor database) and this new experiment is uniquely identified using a UUID - this is presented to the client in the event ‘onEMConnectionResult(..)’. Your client can test to see if it is re-connecting to the same experiment by comparing experiment UUIDs and then act accordingly:
- Connected to the same experiment * Use the previously defined metric model and continue as normal (recommended) * Generate a new metric model and continue, returning empty reports for PULL requests for the old metric model
- Connected to a new experiment * Generate a new metric model and continue as normal
If you are reconnecting to an on-going experiment, the EXPERImonitor will assume your client will be able to provide data for the previous metric model sent (although this is not strictly required; see scenario 1 above).
Enhanced metric monitoring
The EXPERImonitor provides client writers with a number of more advanced levels of control over the way their client interacts with the EXPERImonitor - these features are outlined below. For more detailed information, please read the in-line documentation.
Metric PULL semantics
Metrics that will be pulled from the client by the EXPERImonitor can be scheduled and limited by the client. When a client constructs its metric model, it creates MeasurementSets that are associated with an Entity’s attribute. Using the MeasurementSet class, the client is able to:
- Set a limit on the number of times the EXPERImonitor can ask for metric data for this set [see MeasurementSet.setMeasurementRule(..) & MeasurementSet.setMeasurementCountMax(..)]
- Set the frequency at which the EXPERImonitor will ask for metric data for this set [see MeasurementSet.setSamplingInterval(..)]
Entity enabling and disabling
Some clients may wish to signal to the EXPERImonitor that want to enable or disable an Entity during the live monitoring process. The meaning of this is as follows:
- Enabled entities. Pushed metrics will be captured and stored by the EXPERImonitor. If the client supports pulling, the EXPERImonitor will issue pull requests for metrics associated with the entity
- Disabled entities. Any pushed metrics associated with the entity will be discarded by the EXPERImonitor. The EXPERImonitor will not make pull requests for any metrics associated with the entity
Client writers can send ‘enable’ or ‘disable’ signals to the EXPERImonitor by using the EXPERImonitor adapter call EMInterfaceAdapter.sendEntityEnabled(..).
Metric meta-data
As of version V2.2, the EXPERimonitor API allows client writers to add meta-data to their metric model. The advantages of this new data include:
- Multi-value metrics (such as GPS co-ordinated data) can now be more clearly defined
- Enhancements/extensions to data visualisation on the EXPERImonitor dashboard are now possible
Currently the EXPERimonitor dashboard uses meta-data to enhance the visualisation of QoE data (Likert scales); other visualisations using meta-data are anticipated in later releases. To make use of this feature, you must deploy V2.2 of the EXPERimonitor service (which requires an updated database schema).
The EXPERimonitor Metric class now includes two new fields:
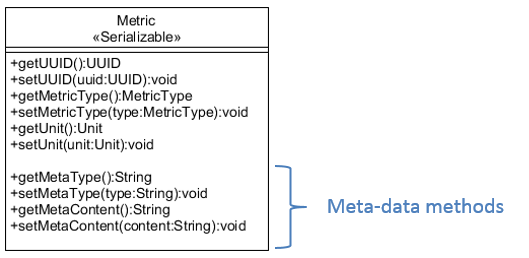
To explore the use of these two fields, we illustrate their use in further specifying ordinal metric as a Likert scale. To describe this in our metric model code we would do the following:
// Metric generator and group created before-hand
// MetricGroup mg = new MetricGroup(); ... etc

// Create user (as an Entity)
Entity entity = new Entity();
entity.setName( "My User" );

// Create an attribute describing UX element
Attribute attr = MetricHelper.createAttribute( "Application ease of use",
                                               "Perception of application 'X' ease-of-use",
                                               entity );

// Create a measurement set and link to the attribute (and metric group)
MeasurementSet ms =
        MetricHelper.createMeasurementSet( attr,
                                           MetricType.ORDINAL,
                                           new Unit( "Point scale" ),
                                           mg );

// Enhance metric of measurement set with meta-data
Metric metric = ms.getMetric();
metric.setMetaType("Likert scale" );
metric.setMetaContent( "very difficut,difficult,not difficult/easy,easy,very easy" );
The example above adds Likert Scale semantics to the measurement set (i.e., the actual point scale labels, their order and total number). Version V2.2 of the EXPERimontor dashboard recognizes the ‘Likert scale’ meta-type and uses it in its visualisation functions. Please note that the use of meta-data is optional for client writers and that older (EXPERImonitor) clients will still work without including meta-data in the code.