Using the EXPERImonitor Dashboard
After building and deploying the EXPERImonitor it is then possible to configure the EXPERImonitor, start and control an experimental process using the EXPERImonitor Dashboard.
Configuration View
After deploying the EXPERImonitor, you should be able to access the EXPERImonitor Configuration page in your browser (see Getting started with the EXPERImonitor section):
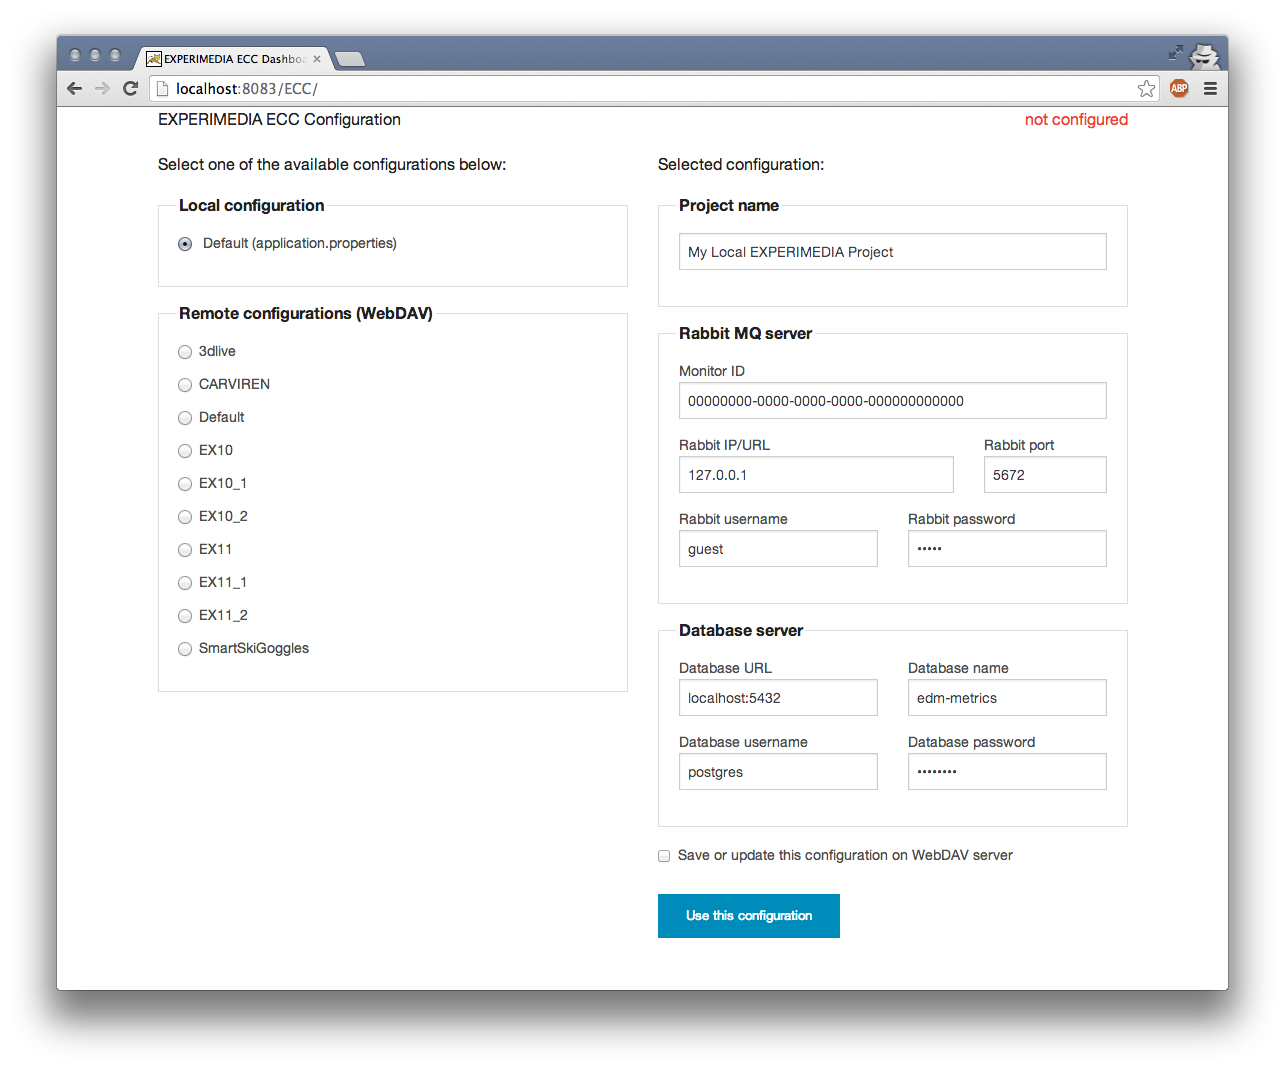
You should be able to use any configuration by manually entering the details on the right side of the screen, choose between or use as a template:
- Local configuration loaded from application.properties file (located in eccService/src/main/resources folder in source distribution or in EccService-2.2/WEB-INF/classes folder in your web server deployment).
- Remote configurations located at WebDAV server config.experimedia.eu.
Once you have selected a configuration, you have an option to save it on config.experimedia.eu by checking “Save or update this configuration on WebDAV server” (existing configurations will be overwritten). Use this configuration button will submit the configuration to the EXPERImonitor. In case of configuration being invalid or selected RabbitMQ/Database servers inaccessible, a warning message will be displayed and you will be able to edit the configuration and try again. Otherwise, you should be redirected to the Experiment view of the Dashboard.
Experiment View
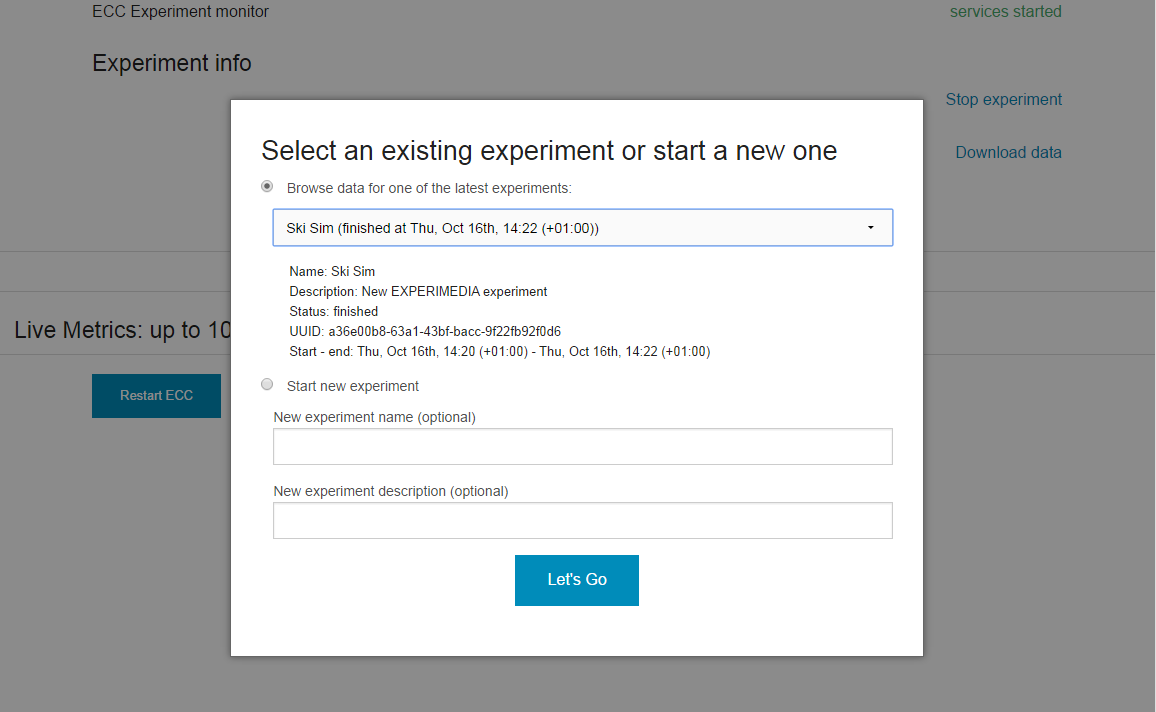
Depending on your current EXPERImonitor state (experiment in progress, previous experiments stored in the database, clean install), this view will always show a dialog window with all or some of the following options:
- Go to current experiment (only if an experiment is in progress).
- Browse data for one of the latest experiments (previous experiments stored in the database).
- Start new experiment (always available)
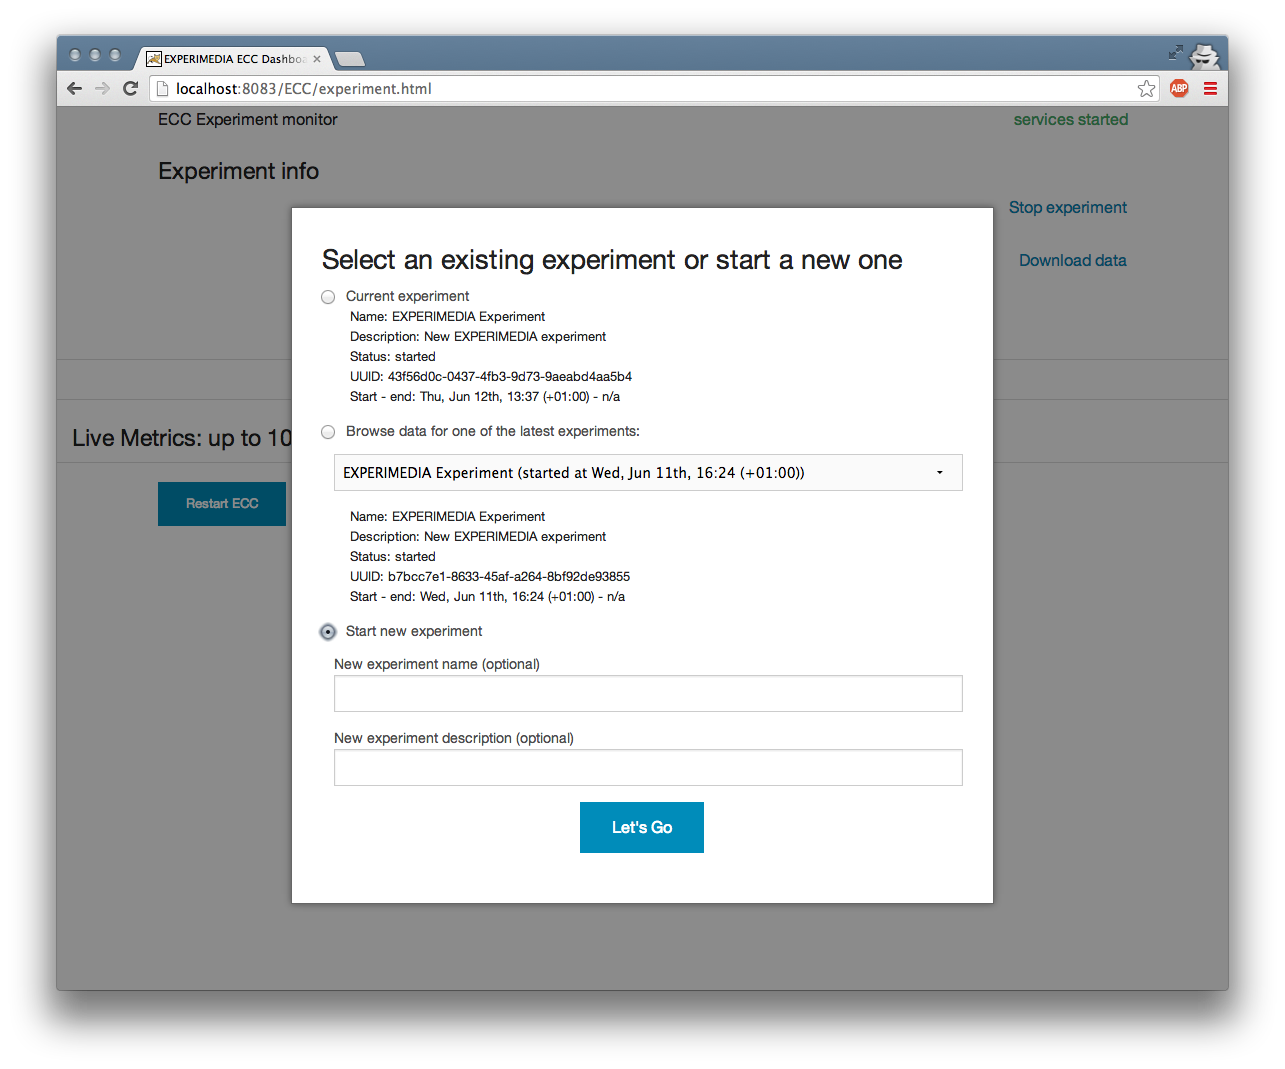
Starting a new experiment
Select Start new experiment in the dialog window and click Let’s Go. Give your experiment a name and description beforehand, which is optional. You should see the following:
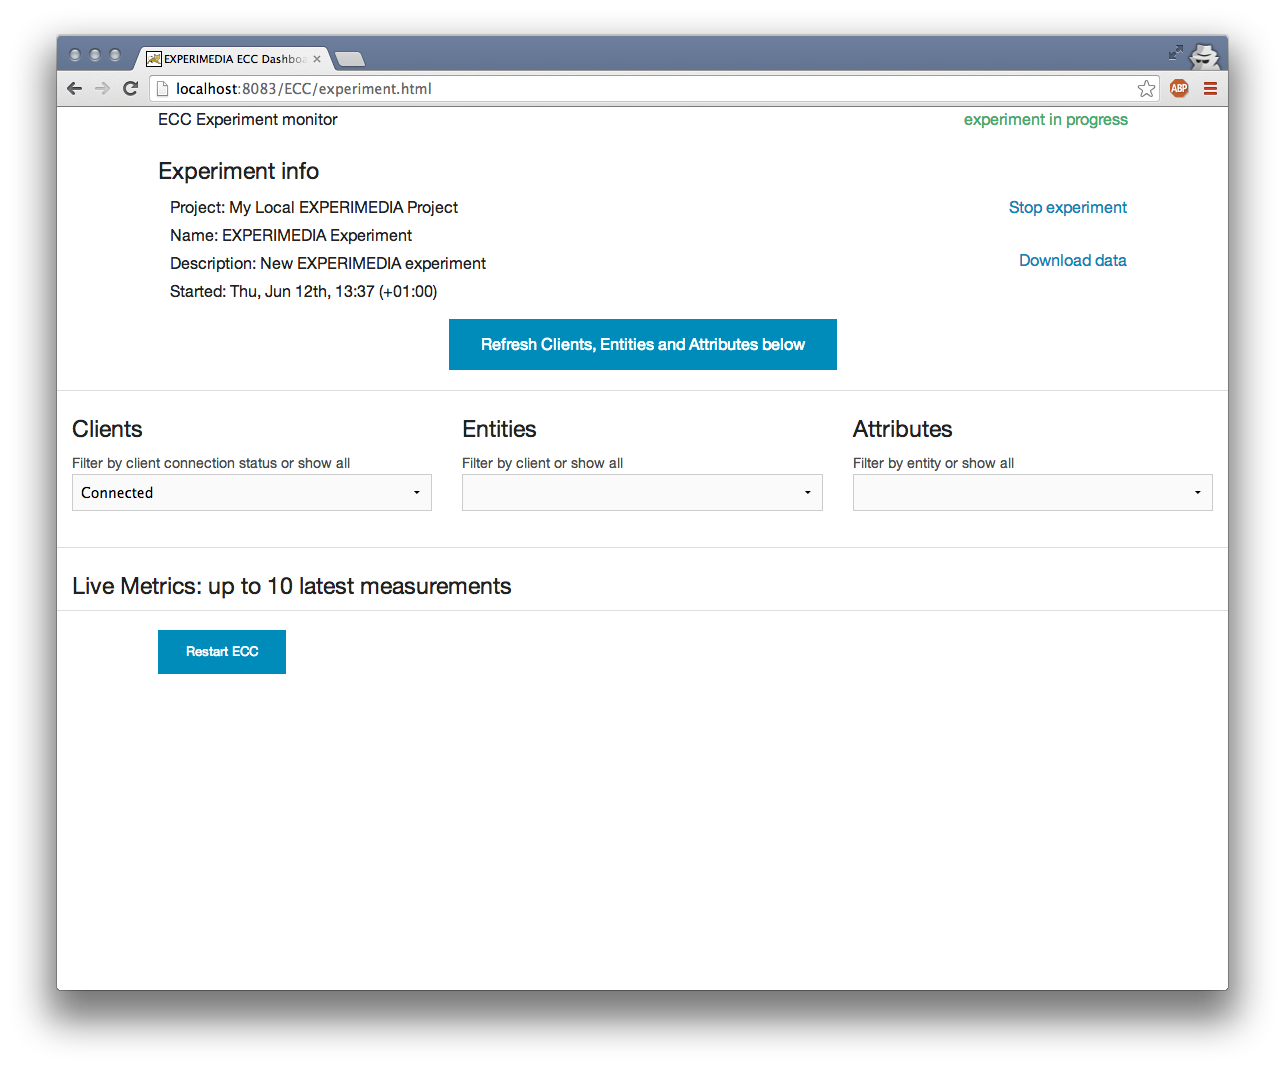
Connect your clients and click Refresh Clients, Entities and Attributes below button. All clients and their metrics should appear like so (EXPERIMEDIA SAD service used as an example):
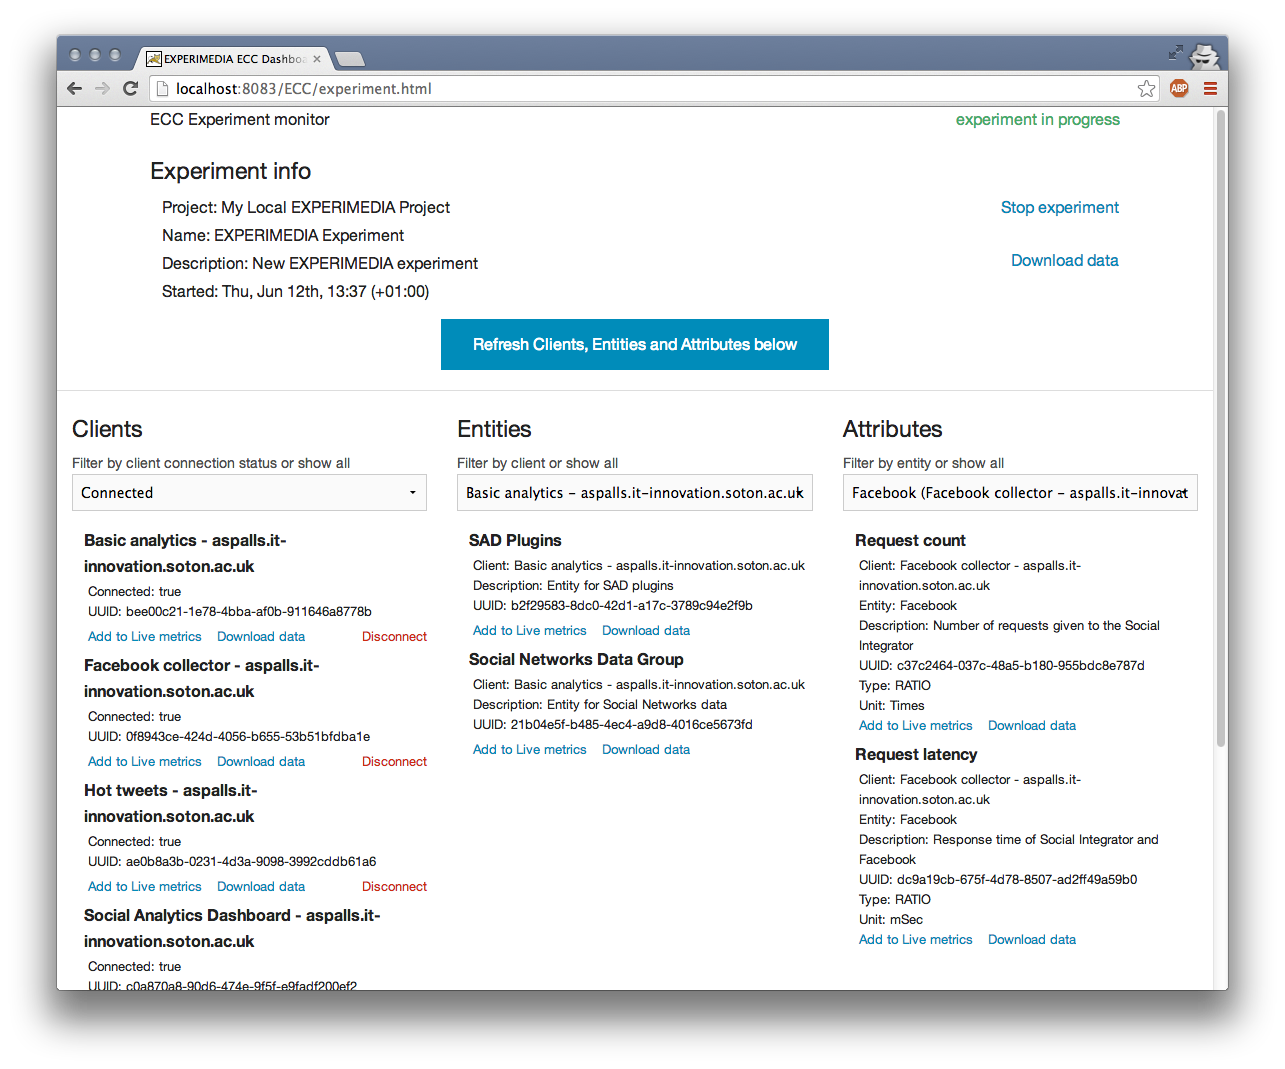
Use drop-down menus in respective columns to filter Clients, Entities (by client) or Attributes (by entity). Download data links will start CSV file download for:
- Whole experiment (all reported entities and attributes).
- Single client (the client’s entities and attributes).
- Single entity (the entity’s attributes).
- Single attribute.
Metrics reported by EXPERImonitor clients can be monitored live in Live Metrics: up to 10 latest measurements part of the view by adding them with Add to Live metrics controls on entries in Clients, Entities or Attributes lists. Live metrics can be removed individually or by Client/Entity/Attribute by clicking on Remove from Live metrics link.
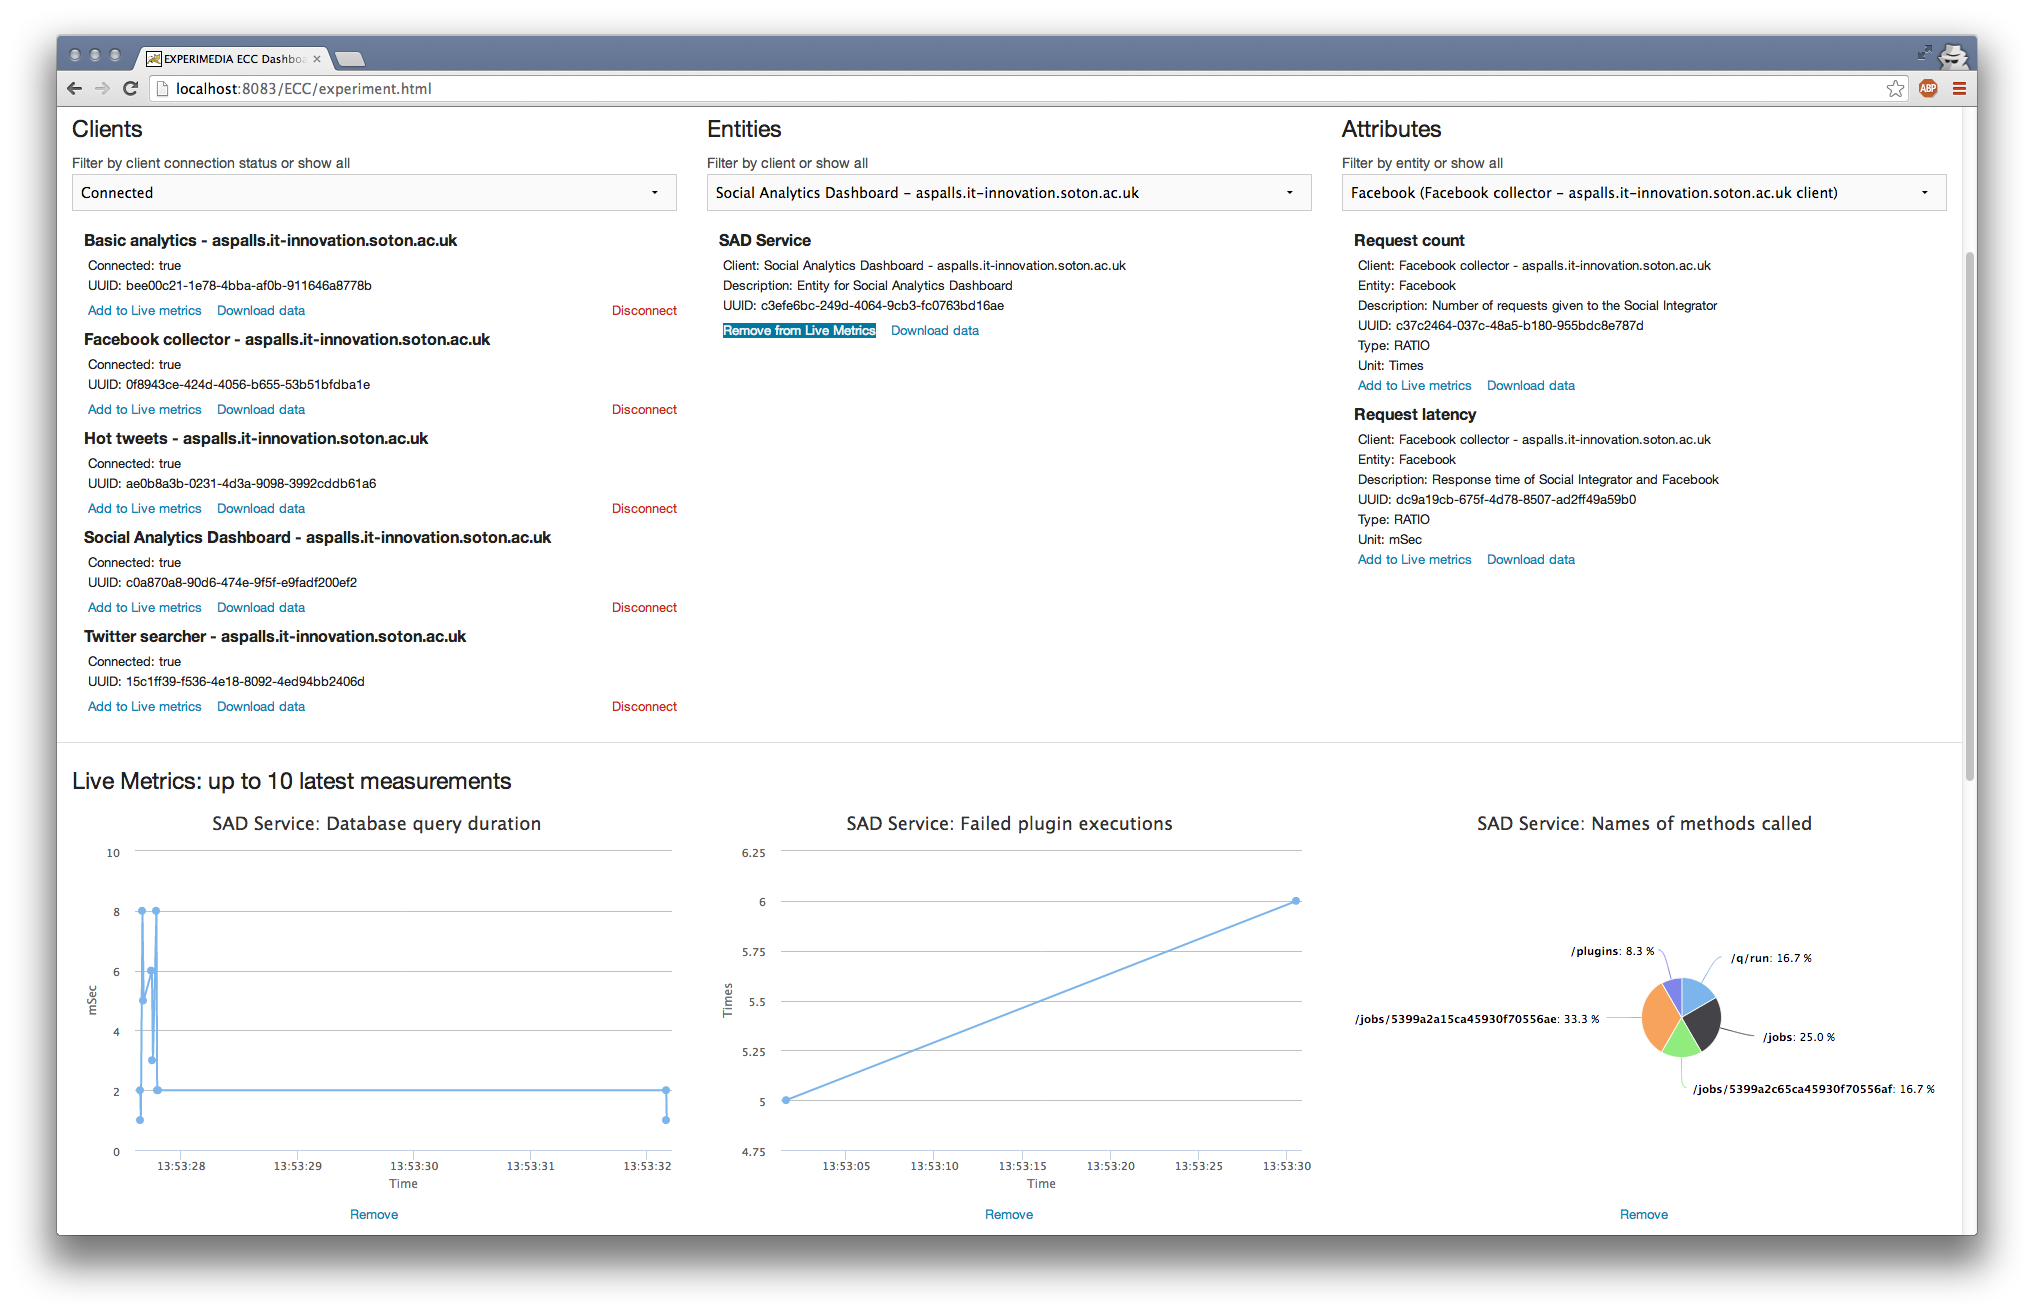
Clicking on Refresh Clients, Entities and Attributes below button will clear live metrics display and refresh all clients and metrics lists.
Joining experiment in progress
Select Current experiment in the dialog window if this option is available and click Let’s Go. You should see currently connected clients and their metrics in Clients, Entities, Attributes part of the view. You will have to use Refresh Clients, Entities and Attributes below button to keep that list current.
Data Explorer View
Exploring data from a completed experiment
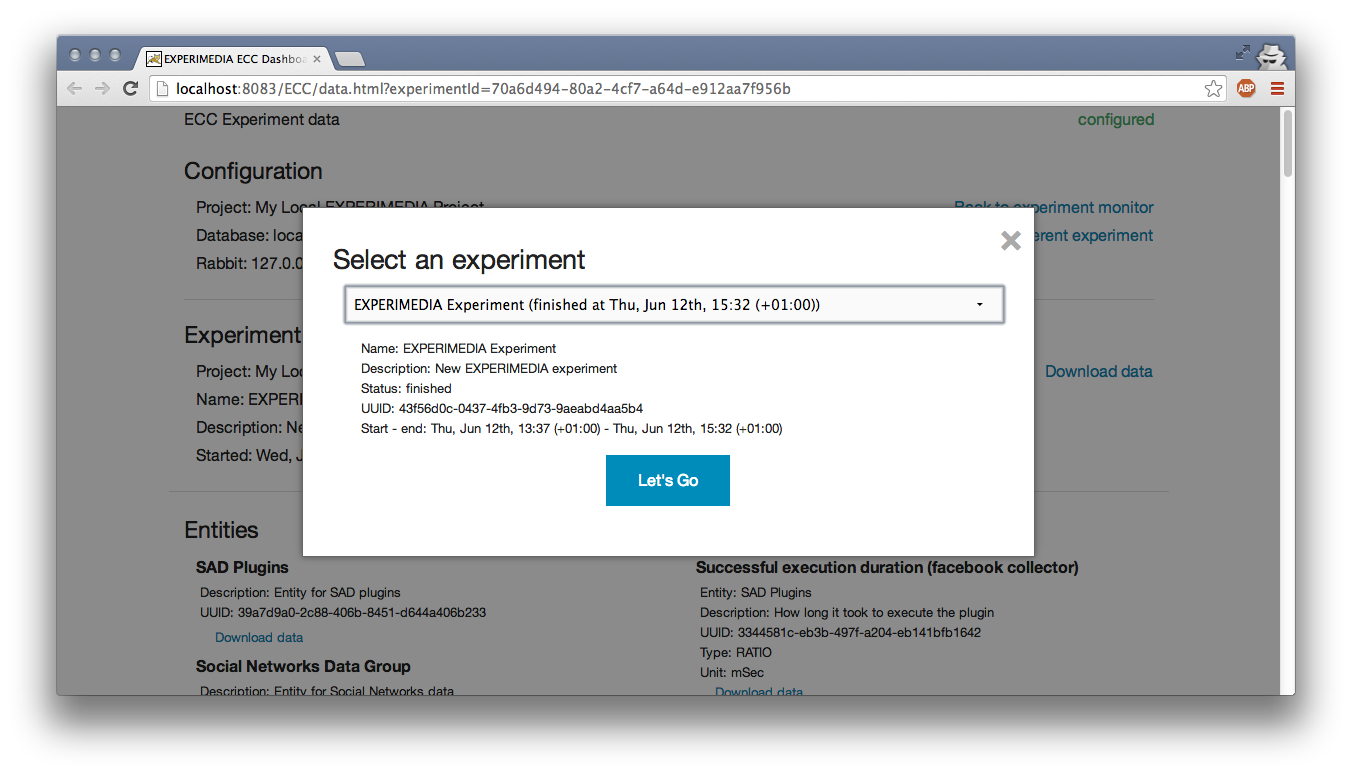
If the database selected in your current configuration contains data from previously run experiments, a Browse data for one of the latest experiments option should be visible on the initial Experiment view dialog window. Select that option and one of the previous experiments from the drop down list underneath and click on Let’s Go button. You should be redirected to the data explorer provenance view of the selected experiment.
The provenance view uses the captured provenance data to link together participants and the services they interacted with. Participants often have metric data associated with them (for instance Likert QoE measurements) and services commonly report QoS metrics such as CPU load. The provenance data helps link these otherwise disparate entities together.
The provenance view currently supports three different configurable widgets:
# Participant QoE: where Likert data from participants can be explored; # Participant activities: displaying all the activities performed by a participant; # Service QoS: showing service metrics overlayed with participant activity times.
New widgets can be added to the bottom of the list using the links at the top and often one widget will propose an additional widget (through a hyperlink) which, if selected, will appear below.
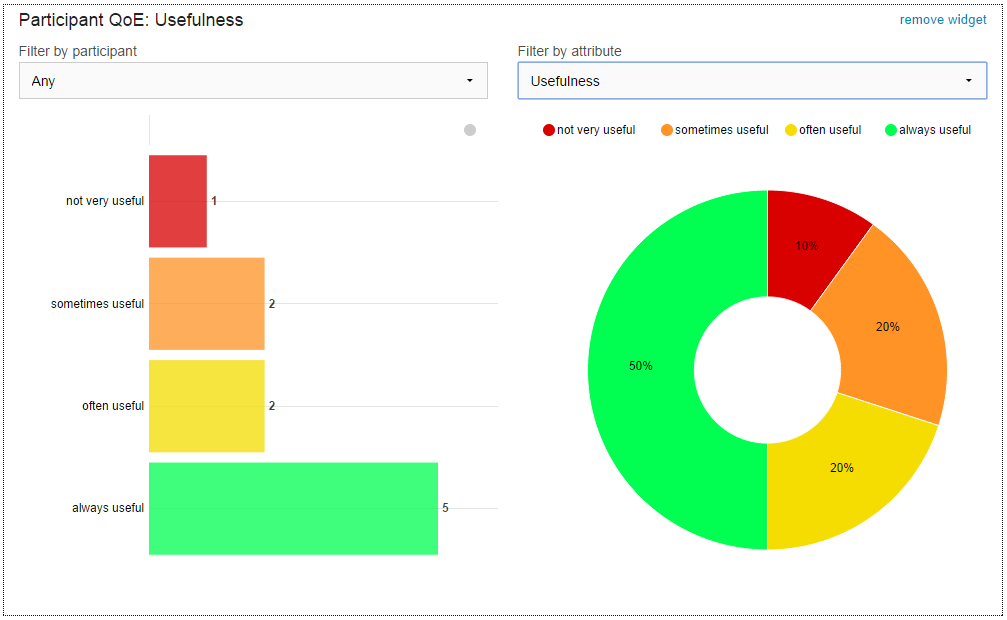
Participant QoE Widget
If any Likert data has been reported (and correctly annotated using the Metric meta-data) then it will be shown in this widget. the default view shows all participants and all QoE attributes:
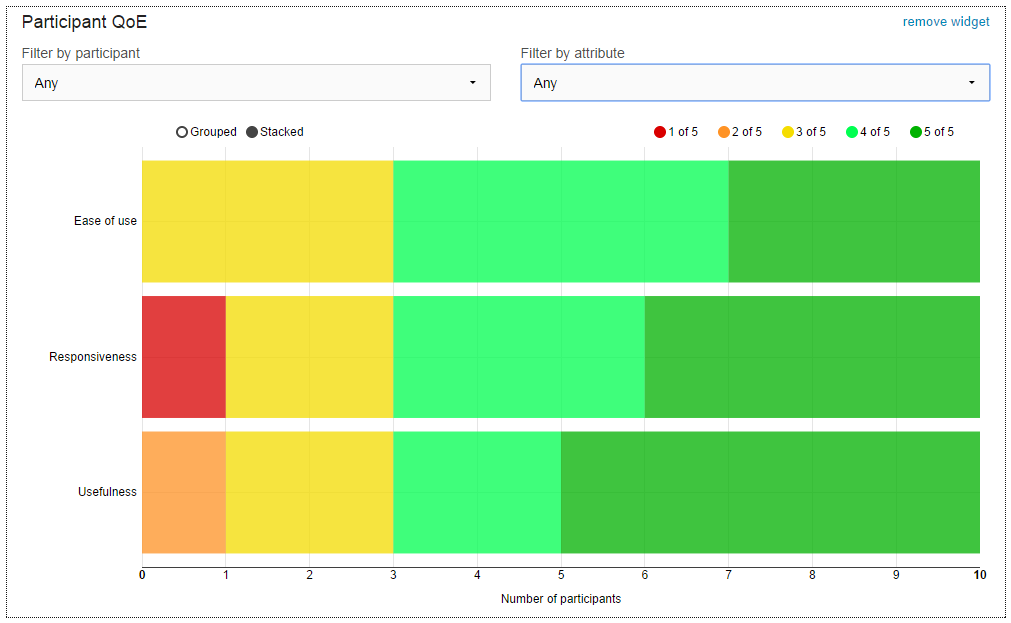
Hovering the mouse over the graph will display additional information in a tooltip. Different parts of the dataset can be disabled and enabled by clicking on the items in the key (“1 of 5” for instance). Clicking on part of the chart will display the participants who reported the data underneath, linking to their activity lists. A single user can be selected with the first drop-down filter, in which case their attributes will be displayed in a simple table. A single attribute (and all users) may be selected using the second drop-down filter, leading to am alternative display of that segment of the data:
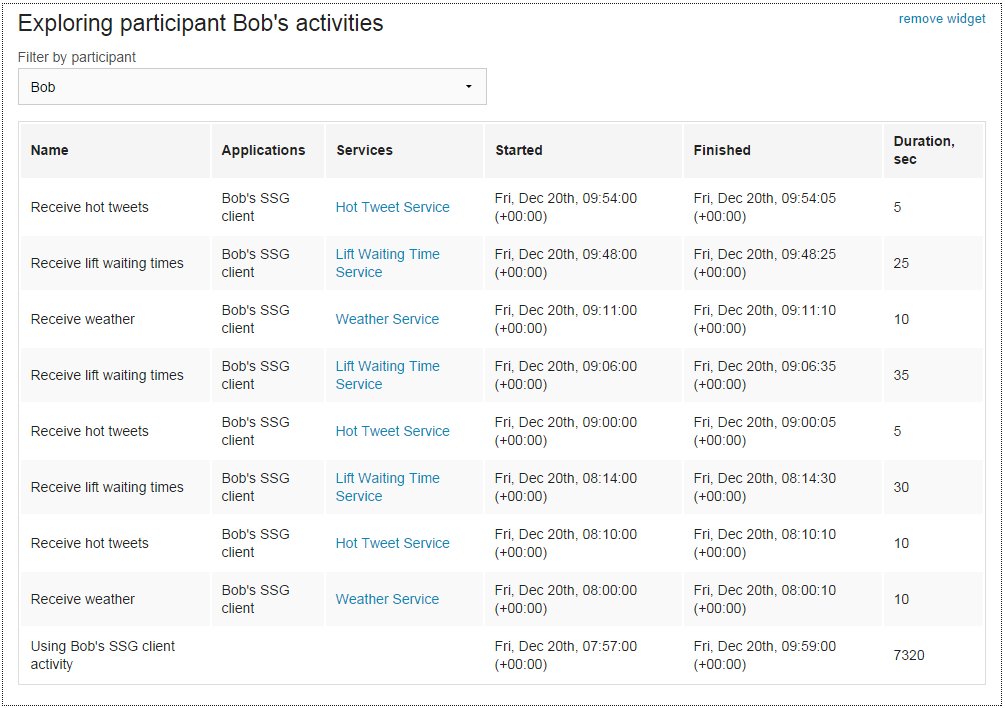
Participant Activities Widget
The Participant Activities widget will display all the activities performed by a single selected participant. The data can be sorted by clicking on the column headings. The widget works on the basis that a participant uses an application which uses services on their behalf. Clicking on a service link will open a Service QoS widget below pre-configured for the service and user.
Service QoS Widget
Services commonly report metrics such as average response time or CPU load. It can be useful to see how these metrics vary over time, and if at any time the service’s performance was not so good it is useful to be able to see which experiment participants were potentially affected.
A single service must be selected first in this widget but then either a single user’s activity times or all users’ activity times may be overlayed and explored. For instance, by clicking on the “Lift Waiting Time Service” link in the previous figure, the following widget is opened:
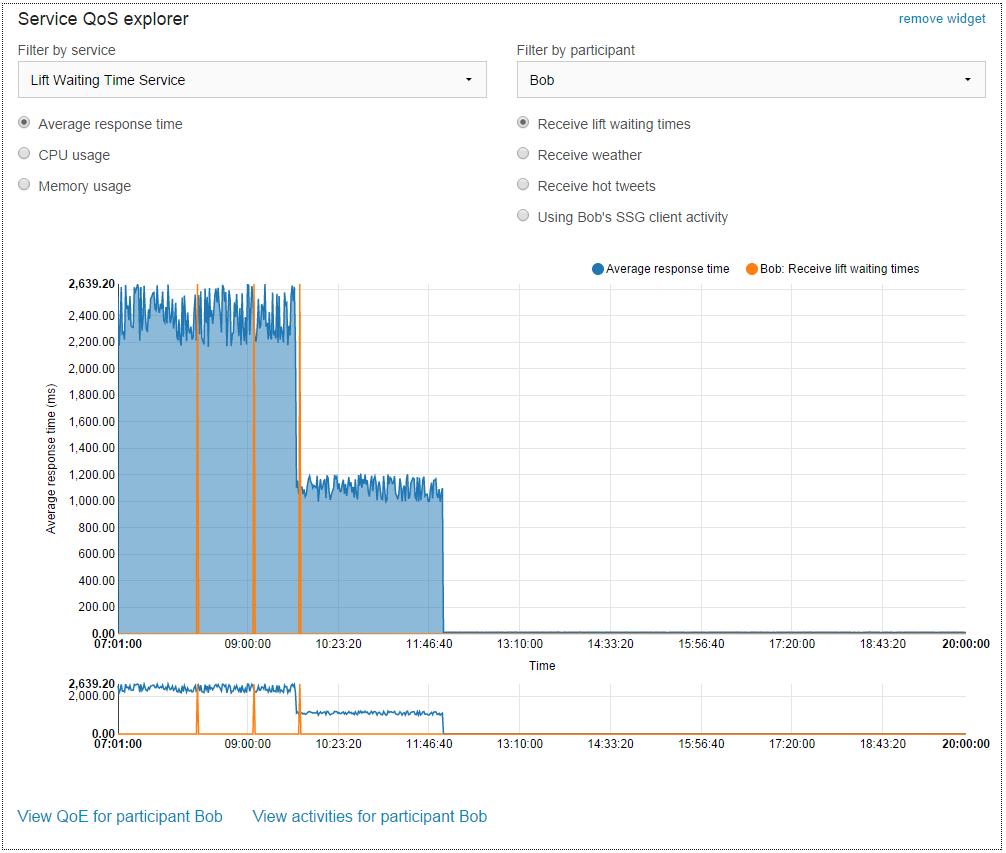
Here we can see the average service rsponse time for the lift waiting time service with the three times that Bob received lift waiting times overlayed. We can see from this chart that Bob did not have a good (or normal) experience with the service. The duration of each activity is shown in this view and the activity of the participant using an application is shown. It is also possible to overlay activities that may not be directly connected with the service (such as the “Receive weather” activity in this case). It is up to the experimenter’s knowledge of the situation to determine which views are appropriate and useful. Below the chart, links to open Participant QoE and Participant Activity widgets are provided.
Selecting “All” participants gives the following view:
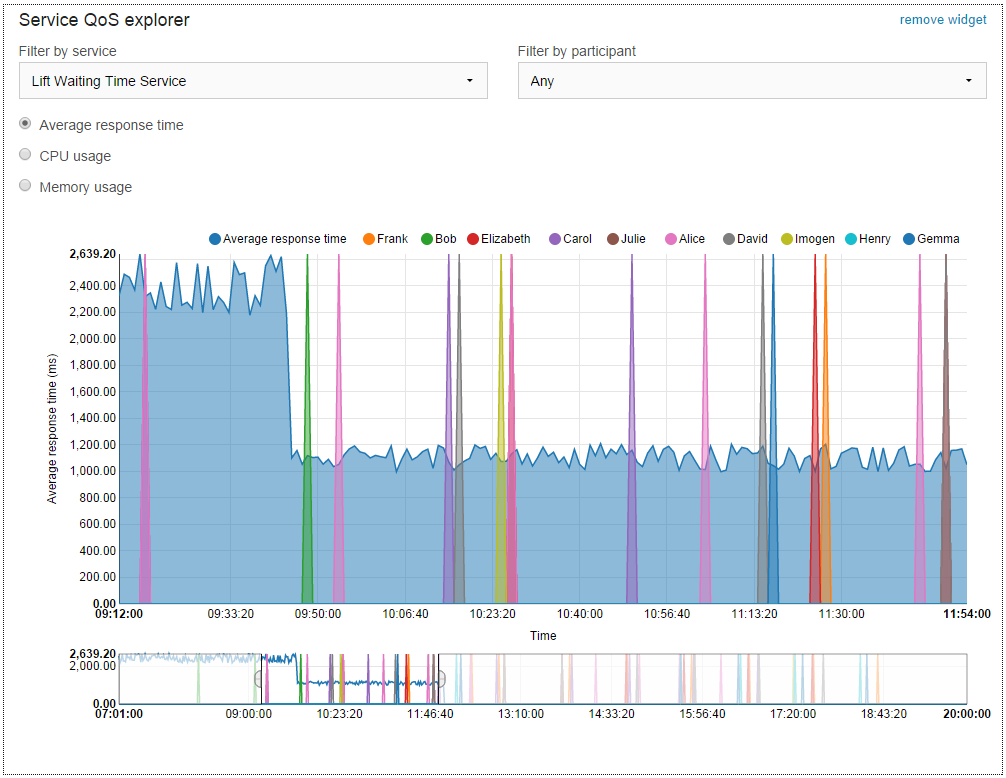
Here, all participant activities directly with the selected service are overlayed. Only the start times are show for clarity. In this view, the zoom function provided by the mini-chart below the main one comes into its own to further explore the data. Individual data sets may be deactivated by clicking on the corresponding item in the key.
Accessing Metric Data
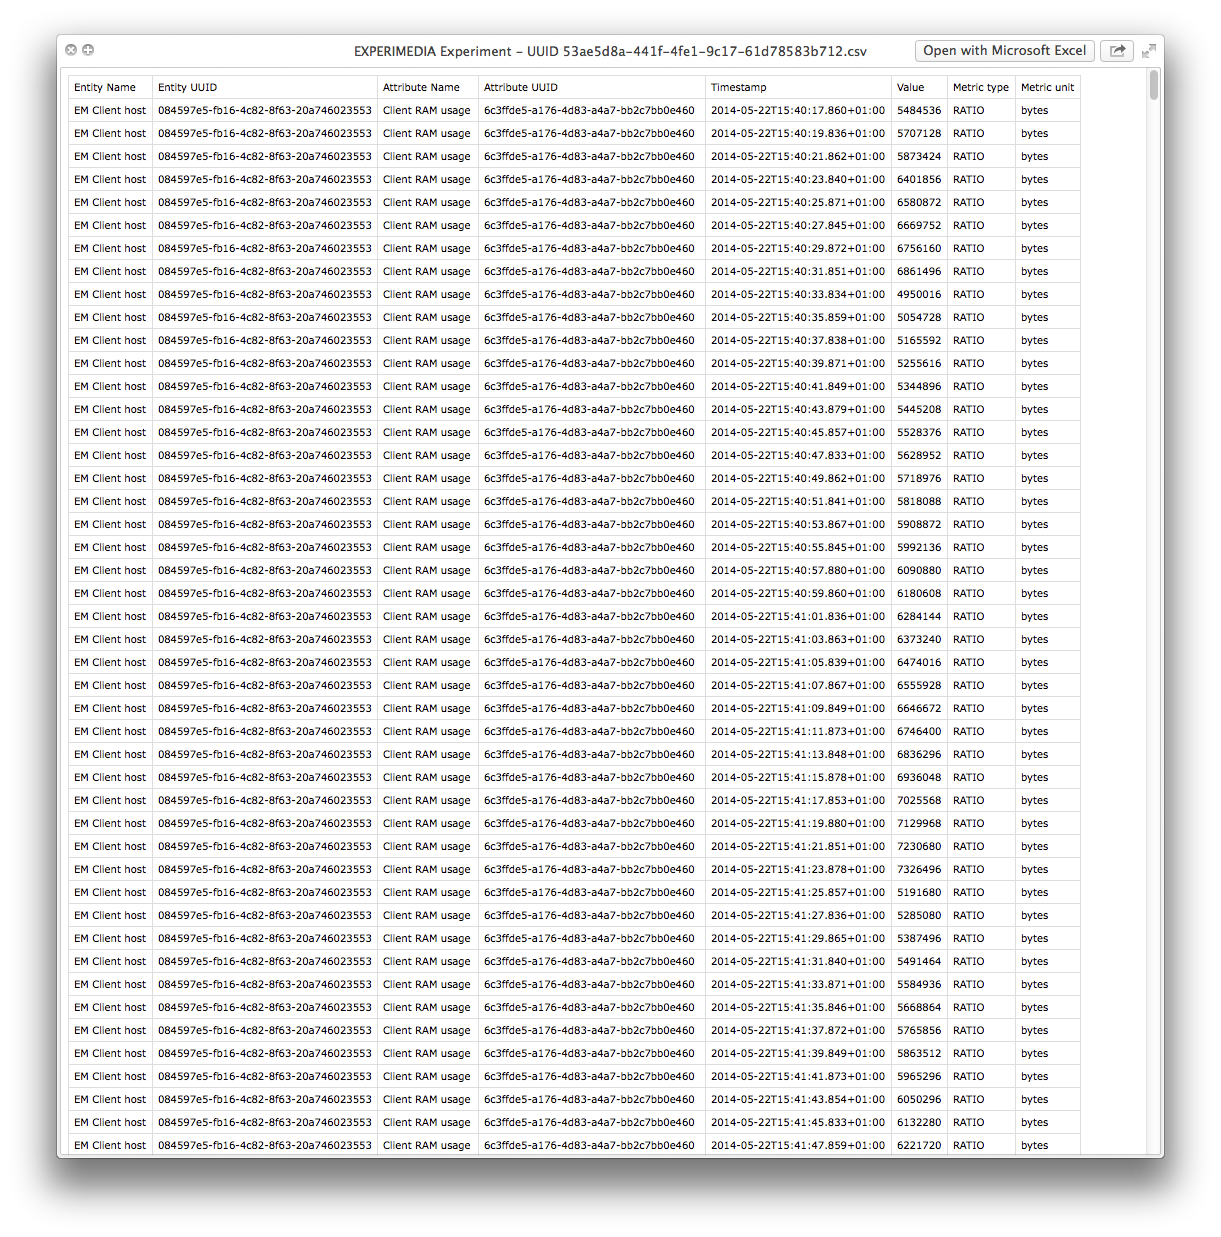
The captured metric data is available to export by clicking on the switch to Metric view link right at the top of the page. In the metric view you can download data for:
- the whole experiment
- an entity
- an attribute
(data per client is not currently available):
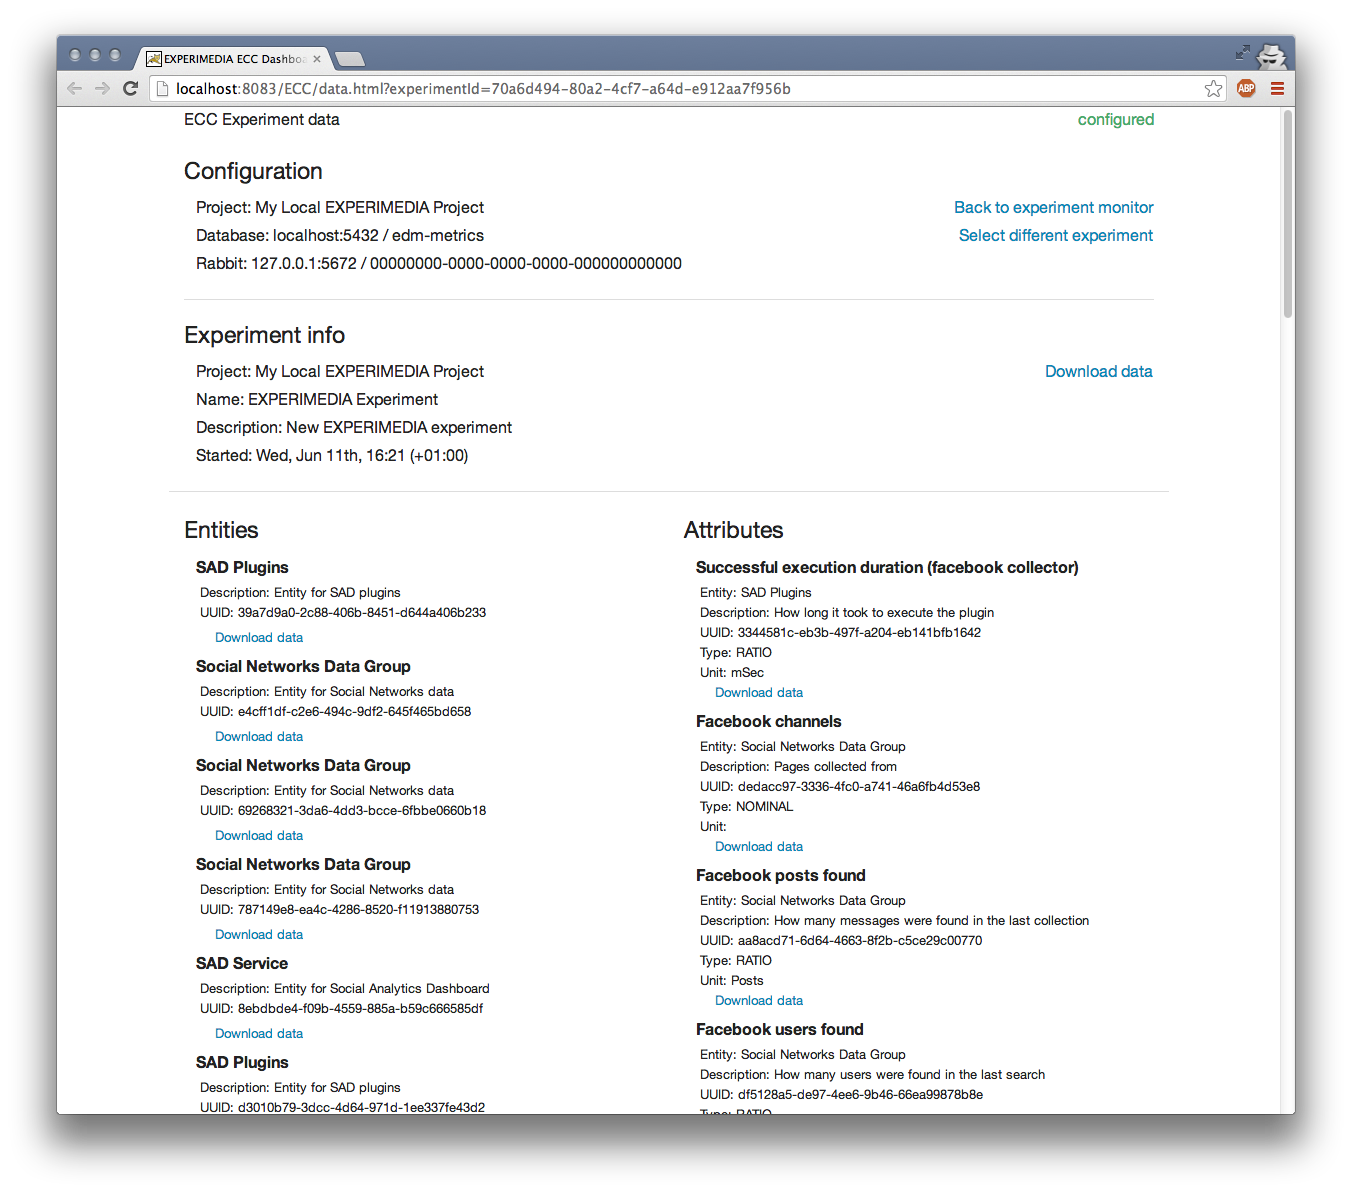
Other controls in this view:
- Back to experiment monitor: goes back to Experiment view.
- Select different experiment lets switch to data view for other previous experiments:
Experiment controls
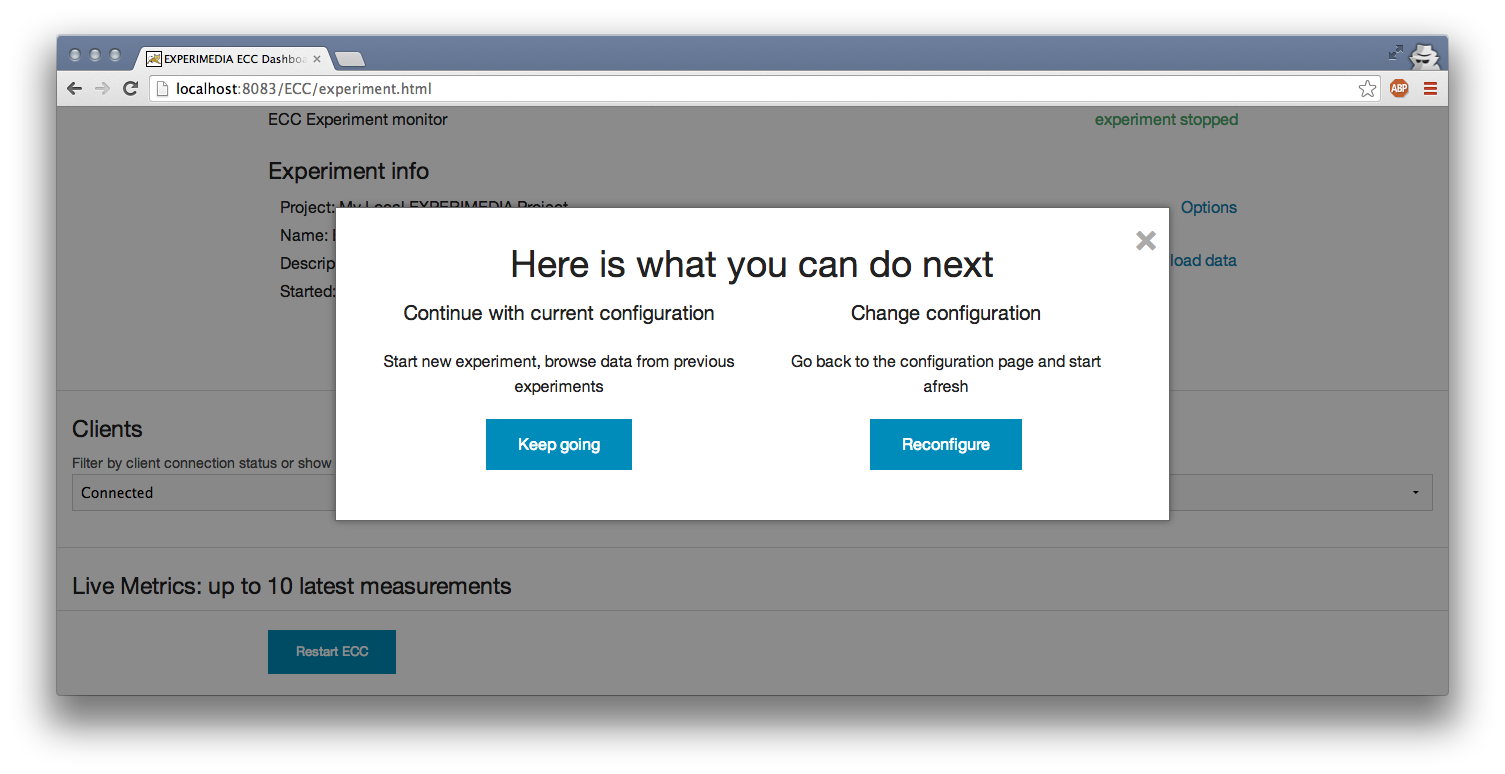
- Stop experiment in the top right corner will disconnect all clients and stop currently running experiment. New Options link will become available:
Restart EXPERImonitor in the bottom left corner will (confirmation is displayed beforehand):
- stop currently running experiment (if one is in progress),
- disconnect all clients,
- close database and Rabbit MQ connections,
- redirect to Configuration view.